Pima vs Bahamian Professional Degree
COMPARE
Pima
Bahamian
Professional Degree
Professional Degree Comparison
Pima
Bahamians
3.3%
PROFESSIONAL DEGREE
0.1/ 100
METRIC RATING
309th/ 347
METRIC RANK
3.7%
PROFESSIONAL DEGREE
1.1/ 100
METRIC RATING
257th/ 347
METRIC RANK
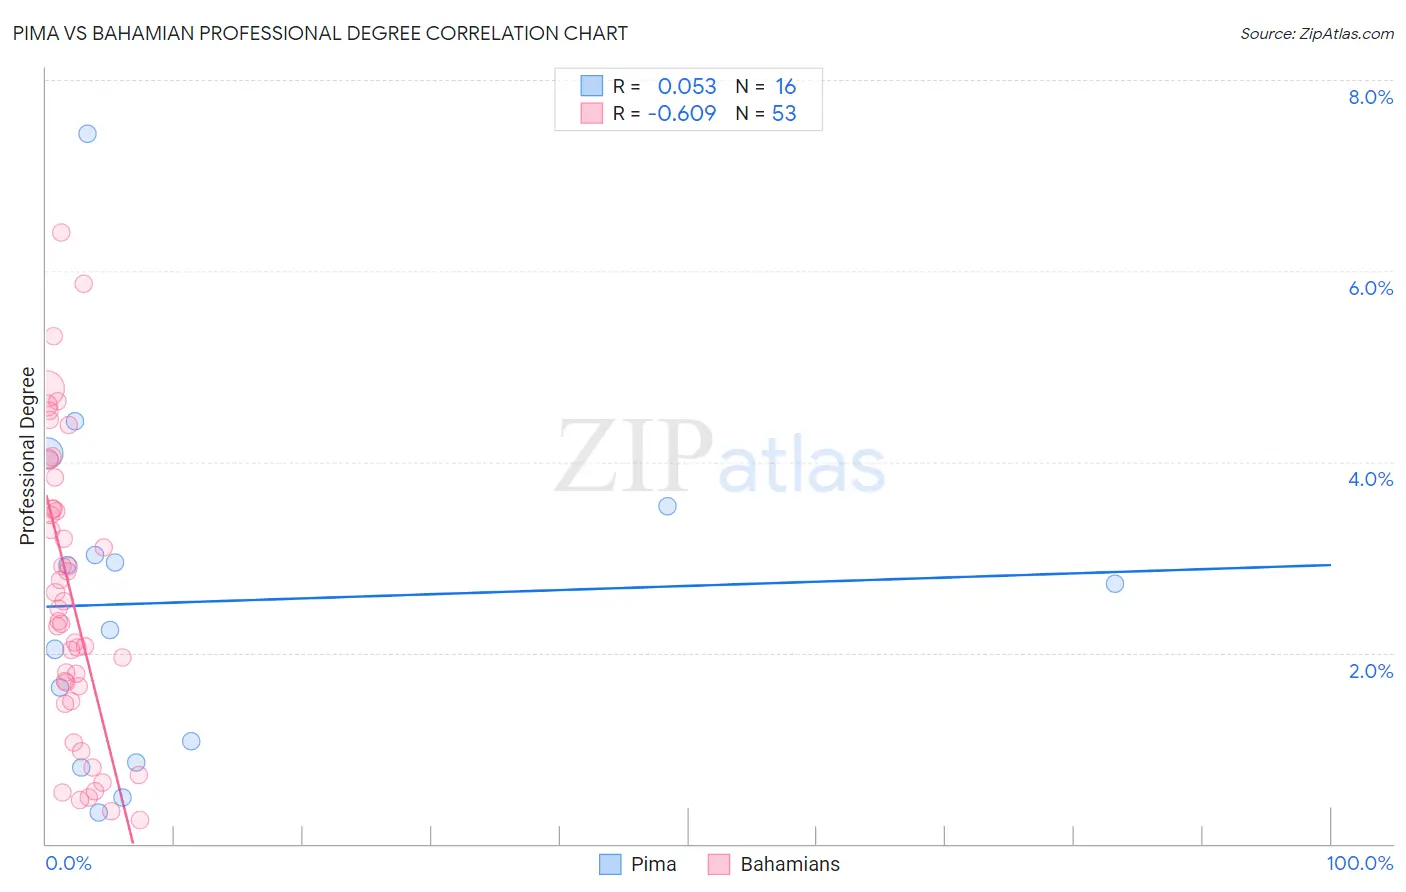
Pima vs Bahamian Professional Degree Correlation Chart
The statistical analysis conducted on geographies consisting of 61,434,084 people shows a slight positive correlation between the proportion of Pima and percentage of population with at least professional degree education in the United States with a correlation coefficient (R) of 0.053 and weighted average of 3.3%. Similarly, the statistical analysis conducted on geographies consisting of 112,564,852 people shows a significant negative correlation between the proportion of Bahamians and percentage of population with at least professional degree education in the United States with a correlation coefficient (R) of -0.609 and weighted average of 3.7%, a difference of 11.3%.
Professional Degree Correlation Summary
| Measurement | Pima | Bahamian |
| Minimum | 0.33% | 0.24% |
| Maximum | 7.4% | 6.4% |
| Range | 7.1% | 6.2% |
| Mean | 2.5% | 2.6% |
| Median | 2.5% | 2.5% |
| Interquartile 25% (IQ1) | 0.96% | 1.6% |
| Interquartile 75% (IQ3) | 3.3% | 3.7% |
| Interquartile Range (IQR) | 2.3% | 2.1% |
| Standard Deviation (Sample) | 1.8% | 1.5% |
| Standard Deviation (Population) | 1.8% | 1.5% |
Similar Demographics by Professional Degree
Demographics Similar to Pima by Professional Degree
In terms of professional degree, the demographic groups most similar to Pima are Shoshone (3.3%, a difference of 0.010%), Immigrants from Latin America (3.3%, a difference of 0.32%), Cherokee (3.3%, a difference of 0.47%), Samoan (3.3%, a difference of 0.51%), and Sioux (3.3%, a difference of 1.1%).
| Demographics | Rating | Rank | Professional Degree |
| Malaysians | 0.2 /100 | #302 | Tragic 3.4% |
| Immigrants | Haiti | 0.2 /100 | #303 | Tragic 3.4% |
| Cajuns | 0.2 /100 | #304 | Tragic 3.4% |
| Chickasaw | 0.1 /100 | #305 | Tragic 3.4% |
| Cape Verdeans | 0.1 /100 | #306 | Tragic 3.4% |
| Samoans | 0.1 /100 | #307 | Tragic 3.3% |
| Shoshone | 0.1 /100 | #308 | Tragic 3.3% |
| Pima | 0.1 /100 | #309 | Tragic 3.3% |
| Immigrants | Latin America | 0.1 /100 | #310 | Tragic 3.3% |
| Cherokee | 0.1 /100 | #311 | Tragic 3.3% |
| Sioux | 0.1 /100 | #312 | Tragic 3.3% |
| Yuman | 0.1 /100 | #313 | Tragic 3.3% |
| Mexican American Indians | 0.1 /100 | #314 | Tragic 3.3% |
| Immigrants | Laos | 0.1 /100 | #315 | Tragic 3.2% |
| Puerto Ricans | 0.1 /100 | #316 | Tragic 3.2% |
Demographics Similar to Bahamians by Professional Degree
In terms of professional degree, the demographic groups most similar to Bahamians are Immigrants from St. Vincent and the Grenadines (3.7%, a difference of 0.080%), African (3.7%, a difference of 0.30%), Indonesian (3.7%, a difference of 0.31%), Iroquois (3.7%, a difference of 0.37%), and Osage (3.7%, a difference of 0.47%).
| Demographics | Rating | Rank | Professional Degree |
| Immigrants | Fiji | 1.5 /100 | #250 | Tragic 3.7% |
| Immigrants | Nicaragua | 1.4 /100 | #251 | Tragic 3.7% |
| Jamaicans | 1.4 /100 | #252 | Tragic 3.7% |
| Pueblo | 1.4 /100 | #253 | Tragic 3.7% |
| Tongans | 1.3 /100 | #254 | Tragic 3.7% |
| Osage | 1.2 /100 | #255 | Tragic 3.7% |
| Iroquois | 1.2 /100 | #256 | Tragic 3.7% |
| Bahamians | 1.1 /100 | #257 | Tragic 3.7% |
| Immigrants | St. Vincent and the Grenadines | 1.1 /100 | #258 | Tragic 3.7% |
| Africans | 1.0 /100 | #259 | Tragic 3.7% |
| Indonesians | 1.0 /100 | #260 | Tragic 3.7% |
| Immigrants | Guyana | 1.0 /100 | #261 | Tragic 3.7% |
| U.S. Virgin Islanders | 1.0 /100 | #262 | Tragic 3.7% |
| Hopi | 0.9 /100 | #263 | Tragic 3.6% |
| Immigrants | Cambodia | 0.9 /100 | #264 | Tragic 3.6% |