Immigrants from Syria vs Spaniard Professional Degree
COMPARE
Immigrants from Syria
Spaniard
Professional Degree
Professional Degree Comparison
Immigrants from Syria
Spaniards
4.9%
PROFESSIONAL DEGREE
96.0/ 100
METRIC RATING
117th/ 347
METRIC RANK
4.4%
PROFESSIONAL DEGREE
52.0/ 100
METRIC RATING
172nd/ 347
METRIC RANK
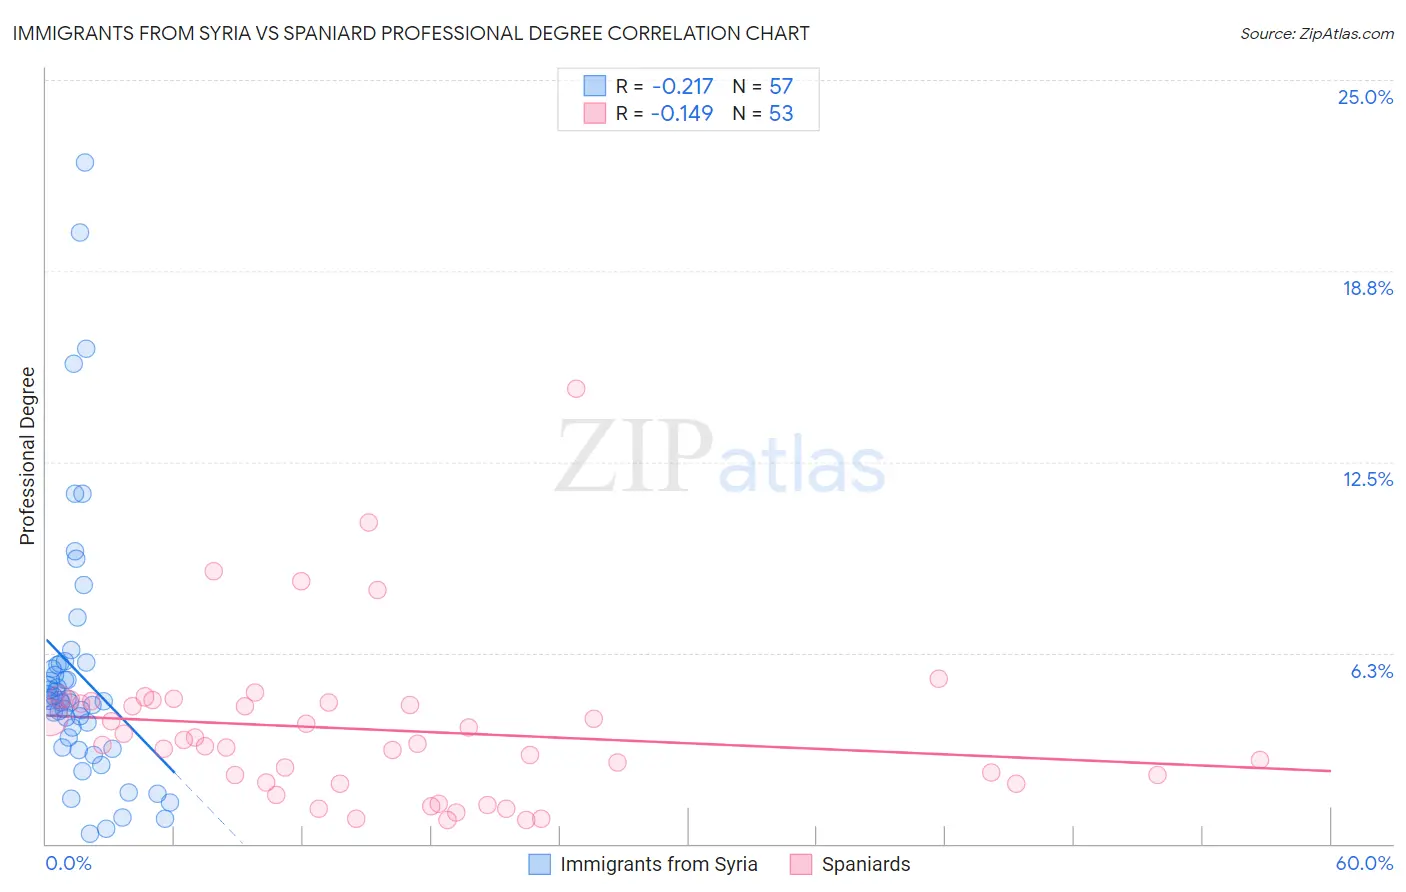
Immigrants from Syria vs Spaniard Professional Degree Correlation Chart
The statistical analysis conducted on geographies consisting of 174,041,005 people shows a weak negative correlation between the proportion of Immigrants from Syria and percentage of population with at least professional degree education in the United States with a correlation coefficient (R) of -0.217 and weighted average of 4.9%. Similarly, the statistical analysis conducted on geographies consisting of 441,720,376 people shows a poor negative correlation between the proportion of Spaniards and percentage of population with at least professional degree education in the United States with a correlation coefficient (R) of -0.149 and weighted average of 4.4%, a difference of 11.3%.
Professional Degree Correlation Summary
| Measurement | Immigrants from Syria | Spaniard |
| Minimum | 0.31% | 0.77% |
| Maximum | 22.3% | 14.9% |
| Range | 22.0% | 14.1% |
| Mean | 5.6% | 3.7% |
| Median | 4.7% | 3.3% |
| Interquartile 25% (IQ1) | 3.3% | 2.0% |
| Interquartile 75% (IQ3) | 5.9% | 4.7% |
| Interquartile Range (IQR) | 2.5% | 2.7% |
| Standard Deviation (Sample) | 4.3% | 2.6% |
| Standard Deviation (Population) | 4.3% | 2.6% |
Similar Demographics by Professional Degree
Demographics Similar to Immigrants from Syria by Professional Degree
In terms of professional degree, the demographic groups most similar to Immigrants from Syria are Croatian (4.9%, a difference of 0.0%), Venezuelan (4.9%, a difference of 0.21%), Immigrants from Sudan (4.9%, a difference of 0.54%), Albanian (4.9%, a difference of 0.55%), and Moroccan (5.0%, a difference of 0.68%).
| Demographics | Rating | Rank | Professional Degree |
| Lebanese | 98.0 /100 | #110 | Exceptional 5.0% |
| Brazilians | 97.4 /100 | #111 | Exceptional 5.0% |
| Taiwanese | 97.3 /100 | #112 | Exceptional 5.0% |
| Immigrants | Pakistan | 97.2 /100 | #113 | Exceptional 5.0% |
| Immigrants | Morocco | 96.8 /100 | #114 | Exceptional 5.0% |
| Moroccans | 96.8 /100 | #115 | Exceptional 5.0% |
| Venezuelans | 96.3 /100 | #116 | Exceptional 4.9% |
| Immigrants | Syria | 96.0 /100 | #117 | Exceptional 4.9% |
| Croatians | 96.0 /100 | #118 | Exceptional 4.9% |
| Immigrants | Sudan | 95.4 /100 | #119 | Exceptional 4.9% |
| Albanians | 95.3 /100 | #120 | Exceptional 4.9% |
| Immigrants | Moldova | 94.8 /100 | #121 | Exceptional 4.9% |
| Immigrants | Germany | 94.1 /100 | #122 | Exceptional 4.9% |
| Immigrants | Venezuela | 93.8 /100 | #123 | Exceptional 4.8% |
| Immigrants | Eritrea | 93.5 /100 | #124 | Exceptional 4.8% |
Demographics Similar to Spaniards by Professional Degree
In terms of professional degree, the demographic groups most similar to Spaniards are English (4.4%, a difference of 0.28%), Kenyan (4.4%, a difference of 0.29%), Irish (4.4%, a difference of 0.30%), Immigrants from Peru (4.4%, a difference of 0.39%), and Immigrants from Bangladesh (4.4%, a difference of 0.57%).
| Demographics | Rating | Rank | Professional Degree |
| Costa Ricans | 59.9 /100 | #165 | Average 4.5% |
| Immigrants | Colombia | 59.4 /100 | #166 | Average 4.5% |
| Immigrants | Afghanistan | 59.2 /100 | #167 | Average 4.5% |
| Immigrants | Sierra Leone | 58.7 /100 | #168 | Average 4.5% |
| Chinese | 58.6 /100 | #169 | Average 4.5% |
| Immigrants | Zaire | 57.4 /100 | #170 | Average 4.5% |
| Immigrants | Bangladesh | 56.0 /100 | #171 | Average 4.4% |
| Spaniards | 52.0 /100 | #172 | Average 4.4% |
| English | 50.1 /100 | #173 | Average 4.4% |
| Kenyans | 50.0 /100 | #174 | Average 4.4% |
| Irish | 50.0 /100 | #175 | Average 4.4% |
| Immigrants | Peru | 49.3 /100 | #176 | Average 4.4% |
| Celtics | 47.6 /100 | #177 | Average 4.4% |
| Immigrants | Costa Rica | 46.7 /100 | #178 | Average 4.4% |
| Immigrants | Kenya | 45.9 /100 | #179 | Average 4.4% |