Immigrants from France vs Spaniard Professional Degree
COMPARE
Immigrants from France
Spaniard
Professional Degree
Professional Degree Comparison
Immigrants from France
Spaniards
6.8%
PROFESSIONAL DEGREE
100.0/ 100
METRIC RATING
14th/ 347
METRIC RANK
4.4%
PROFESSIONAL DEGREE
52.0/ 100
METRIC RATING
172nd/ 347
METRIC RANK
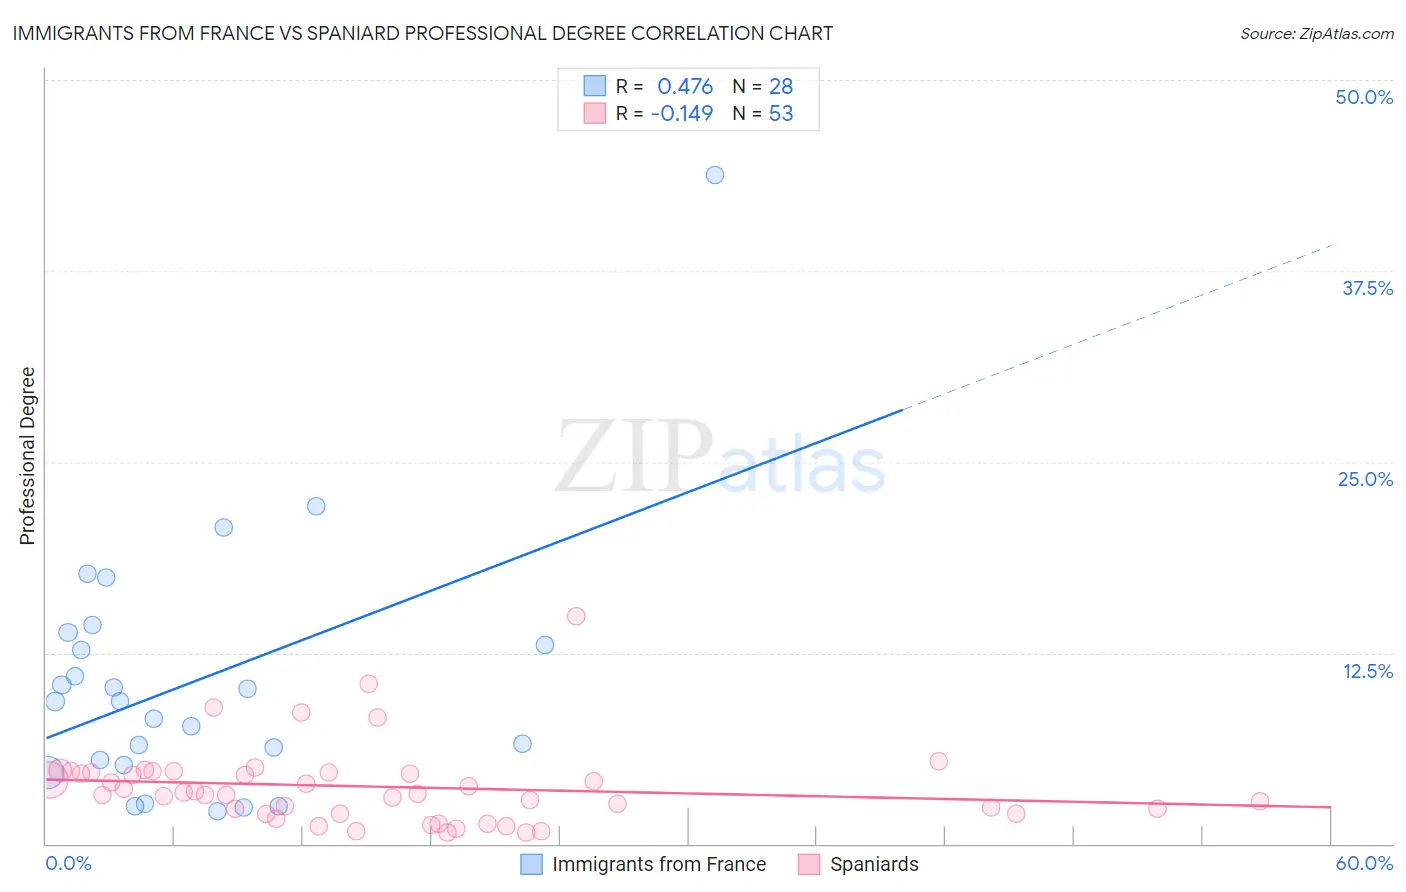
Immigrants from France vs Spaniard Professional Degree Correlation Chart
The statistical analysis conducted on geographies consisting of 287,646,989 people shows a moderate positive correlation between the proportion of Immigrants from France and percentage of population with at least professional degree education in the United States with a correlation coefficient (R) of 0.476 and weighted average of 6.8%. Similarly, the statistical analysis conducted on geographies consisting of 441,720,376 people shows a poor negative correlation between the proportion of Spaniards and percentage of population with at least professional degree education in the United States with a correlation coefficient (R) of -0.149 and weighted average of 4.4%, a difference of 53.9%.
Professional Degree Correlation Summary
| Measurement | Immigrants from France | Spaniard |
| Minimum | 2.1% | 0.77% |
| Maximum | 43.8% | 14.9% |
| Range | 41.6% | 14.1% |
| Mean | 10.7% | 3.7% |
| Median | 9.3% | 3.3% |
| Interquartile 25% (IQ1) | 5.3% | 2.0% |
| Interquartile 75% (IQ3) | 13.5% | 4.7% |
| Interquartile Range (IQR) | 8.1% | 2.7% |
| Standard Deviation (Sample) | 8.5% | 2.6% |
| Standard Deviation (Population) | 8.4% | 2.6% |
Similar Demographics by Professional Degree
Demographics Similar to Immigrants from France by Professional Degree
In terms of professional degree, the demographic groups most similar to Immigrants from France are Immigrants from China (6.7%, a difference of 1.1%), Immigrants from Australia (6.9%, a difference of 1.5%), Immigrants from Sweden (6.7%, a difference of 1.5%), Israeli (6.9%, a difference of 1.9%), and Cypriot (6.9%, a difference of 2.0%).
| Demographics | Rating | Rank | Professional Degree |
| Eastern Europeans | 100.0 /100 | #7 | Exceptional 7.1% |
| Immigrants | Switzerland | 100.0 /100 | #8 | Exceptional 7.1% |
| Immigrants | Taiwan | 100.0 /100 | #9 | Exceptional 7.1% |
| Immigrants | Belgium | 100.0 /100 | #10 | Exceptional 7.0% |
| Cypriots | 100.0 /100 | #11 | Exceptional 6.9% |
| Israelis | 100.0 /100 | #12 | Exceptional 6.9% |
| Immigrants | Australia | 100.0 /100 | #13 | Exceptional 6.9% |
| Immigrants | France | 100.0 /100 | #14 | Exceptional 6.8% |
| Immigrants | China | 100.0 /100 | #15 | Exceptional 6.7% |
| Immigrants | Sweden | 100.0 /100 | #16 | Exceptional 6.7% |
| Immigrants | Eastern Asia | 100.0 /100 | #17 | Exceptional 6.6% |
| Soviet Union | 100.0 /100 | #18 | Exceptional 6.6% |
| Indians (Asian) | 100.0 /100 | #19 | Exceptional 6.5% |
| Immigrants | Denmark | 100.0 /100 | #20 | Exceptional 6.4% |
| Immigrants | Hong Kong | 100.0 /100 | #21 | Exceptional 6.4% |
Demographics Similar to Spaniards by Professional Degree
In terms of professional degree, the demographic groups most similar to Spaniards are English (4.4%, a difference of 0.28%), Kenyan (4.4%, a difference of 0.29%), Irish (4.4%, a difference of 0.30%), Immigrants from Peru (4.4%, a difference of 0.39%), and Immigrants from Bangladesh (4.4%, a difference of 0.57%).
| Demographics | Rating | Rank | Professional Degree |
| Costa Ricans | 59.9 /100 | #165 | Average 4.5% |
| Immigrants | Colombia | 59.4 /100 | #166 | Average 4.5% |
| Immigrants | Afghanistan | 59.2 /100 | #167 | Average 4.5% |
| Immigrants | Sierra Leone | 58.7 /100 | #168 | Average 4.5% |
| Chinese | 58.6 /100 | #169 | Average 4.5% |
| Immigrants | Zaire | 57.4 /100 | #170 | Average 4.5% |
| Immigrants | Bangladesh | 56.0 /100 | #171 | Average 4.4% |
| Spaniards | 52.0 /100 | #172 | Average 4.4% |
| English | 50.1 /100 | #173 | Average 4.4% |
| Kenyans | 50.0 /100 | #174 | Average 4.4% |
| Irish | 50.0 /100 | #175 | Average 4.4% |
| Immigrants | Peru | 49.3 /100 | #176 | Average 4.4% |
| Celtics | 47.6 /100 | #177 | Average 4.4% |
| Immigrants | Costa Rica | 46.7 /100 | #178 | Average 4.4% |
| Immigrants | Kenya | 45.9 /100 | #179 | Average 4.4% |