Japanese vs Somali 4th Grade
COMPARE
Japanese
Somali
4th Grade
4th Grade Comparison
Japanese
Somalis
96.0%
4TH GRADE
0.0/ 100
METRIC RATING
321st/ 347
METRIC RANK
96.6%
4TH GRADE
0.0/ 100
METRIC RATING
296th/ 347
METRIC RANK
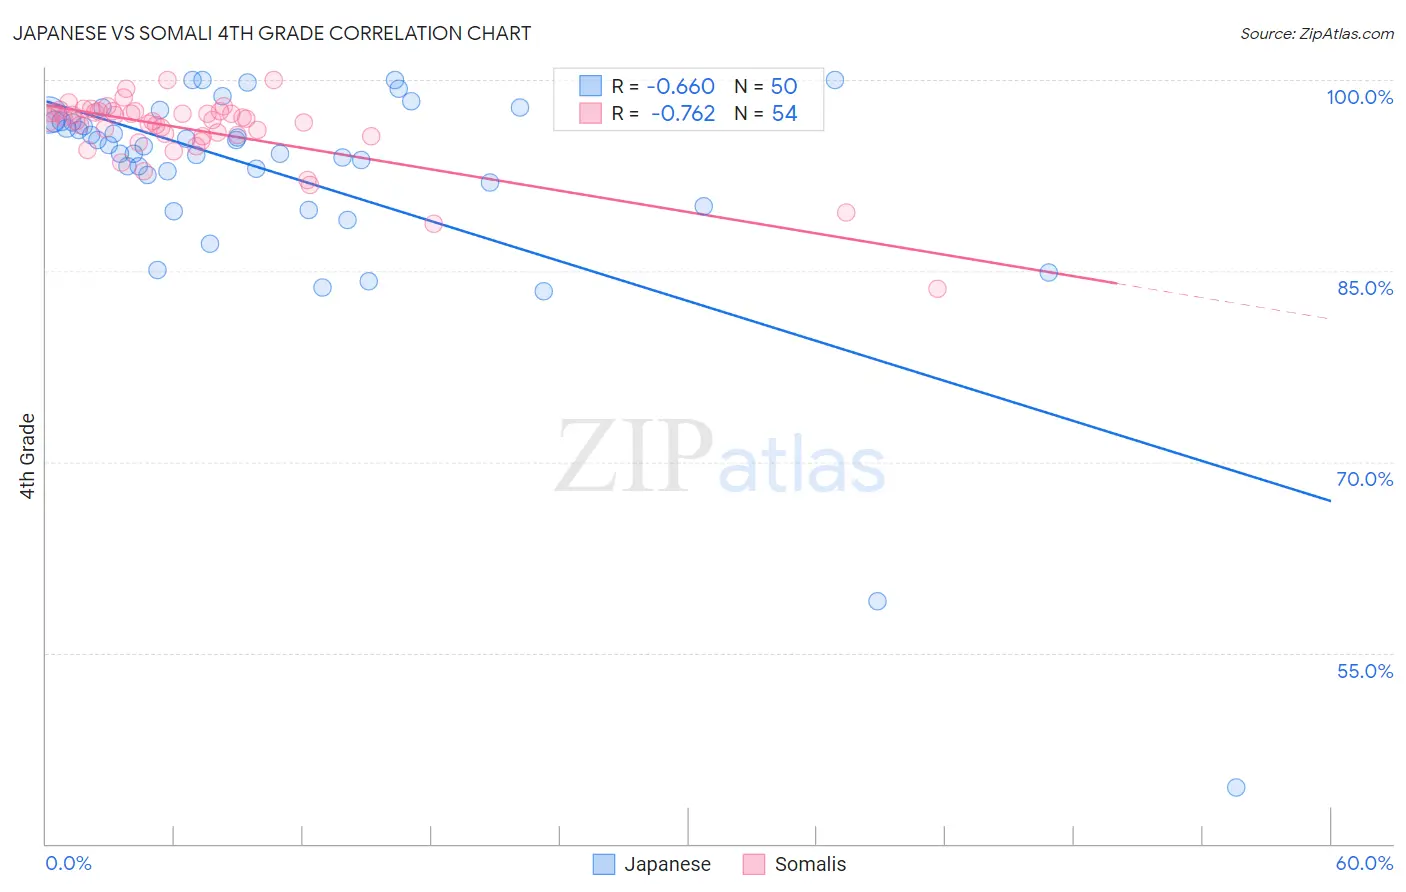
Japanese vs Somali 4th Grade Correlation Chart
The statistical analysis conducted on geographies consisting of 249,183,224 people shows a significant negative correlation between the proportion of Japanese and percentage of population with at least 4th grade education in the United States with a correlation coefficient (R) of -0.660 and weighted average of 96.0%. Similarly, the statistical analysis conducted on geographies consisting of 99,332,457 people shows a strong negative correlation between the proportion of Somalis and percentage of population with at least 4th grade education in the United States with a correlation coefficient (R) of -0.762 and weighted average of 96.6%, a difference of 0.64%.
4th Grade Correlation Summary
| Measurement | Japanese | Somali |
| Minimum | 44.4% | 83.6% |
| Maximum | 100.0% | 100.0% |
| Range | 55.6% | 16.4% |
| Mean | 92.4% | 96.1% |
| Median | 94.8% | 96.9% |
| Interquartile 25% (IQ1) | 92.0% | 95.6% |
| Interquartile 75% (IQ3) | 96.7% | 97.5% |
| Interquartile Range (IQR) | 4.8% | 1.9% |
| Standard Deviation (Sample) | 9.6% | 2.8% |
| Standard Deviation (Population) | 9.5% | 2.8% |
Similar Demographics by 4th Grade
Demographics Similar to Japanese by 4th Grade
In terms of 4th grade, the demographic groups most similar to Japanese are Immigrants from Vietnam (96.0%, a difference of 0.0%), Immigrants from Nicaragua (96.0%, a difference of 0.020%), Immigrants from Belize (96.0%, a difference of 0.030%), Dominican (96.0%, a difference of 0.040%), and Hispanic or Latino (96.0%, a difference of 0.050%).
| Demographics | Rating | Rank | 4th Grade |
| Vietnamese | 0.0 /100 | #314 | Tragic 96.2% |
| Nicaraguans | 0.0 /100 | #315 | Tragic 96.2% |
| Immigrants | Ecuador | 0.0 /100 | #316 | Tragic 96.2% |
| Central American Indians | 0.0 /100 | #317 | Tragic 96.2% |
| Immigrants | Azores | 0.0 /100 | #318 | Tragic 96.1% |
| Belizeans | 0.0 /100 | #319 | Tragic 96.1% |
| Bangladeshis | 0.0 /100 | #320 | Tragic 96.1% |
| Japanese | 0.0 /100 | #321 | Tragic 96.0% |
| Immigrants | Vietnam | 0.0 /100 | #322 | Tragic 96.0% |
| Immigrants | Nicaragua | 0.0 /100 | #323 | Tragic 96.0% |
| Immigrants | Belize | 0.0 /100 | #324 | Tragic 96.0% |
| Dominicans | 0.0 /100 | #325 | Tragic 96.0% |
| Hispanics or Latinos | 0.0 /100 | #326 | Tragic 96.0% |
| Hondurans | 0.0 /100 | #327 | Tragic 96.0% |
| Mexican American Indians | 0.0 /100 | #328 | Tragic 95.8% |
Demographics Similar to Somalis by 4th Grade
In terms of 4th grade, the demographic groups most similar to Somalis are Immigrants from Portugal (96.6%, a difference of 0.010%), Immigrants from Eritrea (96.7%, a difference of 0.030%), Puerto Rican (96.7%, a difference of 0.050%), Malaysian (96.7%, a difference of 0.070%), and Immigrants from Grenada (96.7%, a difference of 0.080%).
| Demographics | Rating | Rank | 4th Grade |
| Immigrants | West Indies | 0.0 /100 | #289 | Tragic 96.7% |
| British West Indians | 0.0 /100 | #290 | Tragic 96.7% |
| Immigrants | Grenada | 0.0 /100 | #291 | Tragic 96.7% |
| Malaysians | 0.0 /100 | #292 | Tragic 96.7% |
| Puerto Ricans | 0.0 /100 | #293 | Tragic 96.7% |
| Immigrants | Eritrea | 0.0 /100 | #294 | Tragic 96.7% |
| Immigrants | Portugal | 0.0 /100 | #295 | Tragic 96.6% |
| Somalis | 0.0 /100 | #296 | Tragic 96.6% |
| Immigrants | Somalia | 0.0 /100 | #297 | Tragic 96.5% |
| Haitians | 0.0 /100 | #298 | Tragic 96.5% |
| Immigrants | Dominica | 0.0 /100 | #299 | Tragic 96.5% |
| Immigrants | South Eastern Asia | 0.0 /100 | #300 | Tragic 96.5% |
| Immigrants | Immigrants | 0.0 /100 | #301 | Tragic 96.5% |
| Immigrants | Cuba | 0.0 /100 | #302 | Tragic 96.4% |
| Guyanese | 0.0 /100 | #303 | Tragic 96.4% |