Japanese vs Blackfeet 7th Grade
COMPARE
Japanese
Blackfeet
7th Grade
7th Grade Comparison
Japanese
Blackfeet
94.0%
7TH GRADE
0.0/ 100
METRIC RATING
314th/ 347
METRIC RANK
96.3%
7TH GRADE
83.9/ 100
METRIC RATING
145th/ 347
METRIC RANK
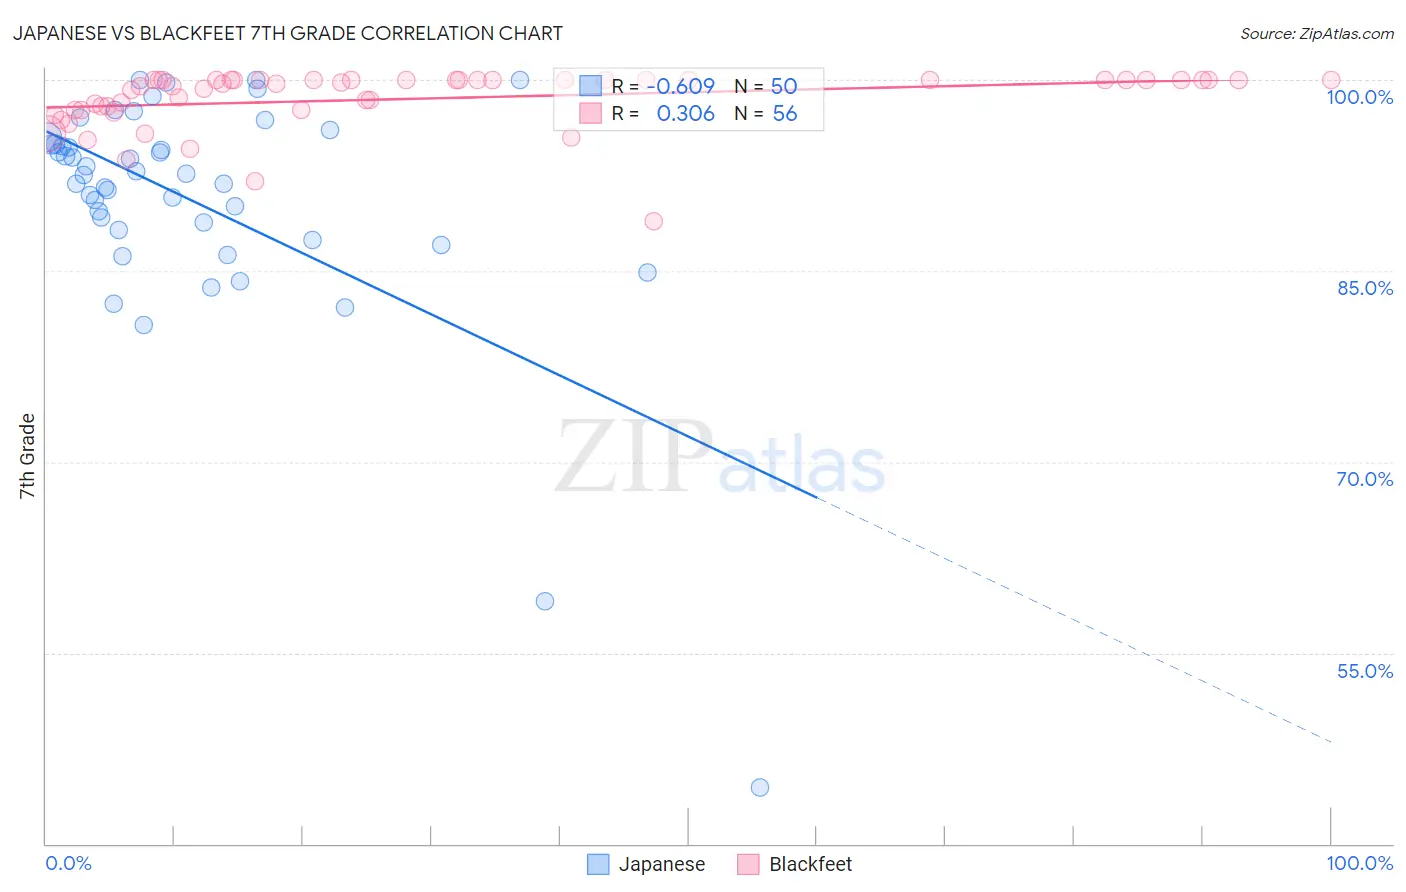
Japanese vs Blackfeet 7th Grade Correlation Chart
The statistical analysis conducted on geographies consisting of 249,183,224 people shows a significant negative correlation between the proportion of Japanese and percentage of population with at least 7th grade education in the United States with a correlation coefficient (R) of -0.609 and weighted average of 94.0%. Similarly, the statistical analysis conducted on geographies consisting of 309,580,957 people shows a mild positive correlation between the proportion of Blackfeet and percentage of population with at least 7th grade education in the United States with a correlation coefficient (R) of 0.306 and weighted average of 96.3%, a difference of 2.5%.
7th Grade Correlation Summary
| Measurement | Japanese | Blackfeet |
| Minimum | 44.4% | 88.9% |
| Maximum | 100.0% | 100.0% |
| Range | 55.6% | 11.1% |
| Mean | 90.5% | 98.5% |
| Median | 92.6% | 99.8% |
| Interquartile 25% (IQ1) | 88.2% | 97.7% |
| Interquartile 75% (IQ3) | 95.0% | 100.0% |
| Interquartile Range (IQR) | 6.8% | 2.3% |
| Standard Deviation (Sample) | 9.5% | 2.3% |
| Standard Deviation (Population) | 9.4% | 2.3% |
Similar Demographics by 7th Grade
Demographics Similar to Japanese by 7th Grade
In terms of 7th grade, the demographic groups most similar to Japanese are Immigrants (94.0%, a difference of 0.030%), Immigrants from Bangladesh (94.0%, a difference of 0.030%), Vietnamese (93.9%, a difference of 0.050%), Puerto Rican (94.0%, a difference of 0.070%), and Immigrants from Caribbean (94.0%, a difference of 0.080%).
| Demographics | Rating | Rank | 7th Grade |
| Immigrants | Portugal | 0.0 /100 | #307 | Tragic 94.2% |
| Cape Verdeans | 0.0 /100 | #308 | Tragic 94.1% |
| Ecuadorians | 0.0 /100 | #309 | Tragic 94.0% |
| Immigrants | Caribbean | 0.0 /100 | #310 | Tragic 94.0% |
| Puerto Ricans | 0.0 /100 | #311 | Tragic 94.0% |
| Immigrants | Immigrants | 0.0 /100 | #312 | Tragic 94.0% |
| Immigrants | Bangladesh | 0.0 /100 | #313 | Tragic 94.0% |
| Japanese | 0.0 /100 | #314 | Tragic 94.0% |
| Vietnamese | 0.0 /100 | #315 | Tragic 93.9% |
| Immigrants | Vietnam | 0.0 /100 | #316 | Tragic 93.9% |
| Immigrants | Cuba | 0.0 /100 | #317 | Tragic 93.8% |
| Immigrants | Ecuador | 0.0 /100 | #318 | Tragic 93.7% |
| Immigrants | Cambodia | 0.0 /100 | #319 | Tragic 93.7% |
| Immigrants | Fiji | 0.0 /100 | #320 | Tragic 93.5% |
| Belizeans | 0.0 /100 | #321 | Tragic 93.5% |
Demographics Similar to Blackfeet by 7th Grade
In terms of 7th grade, the demographic groups most similar to Blackfeet are Immigrants from Eastern Europe (96.3%, a difference of 0.0%), French American Indian (96.3%, a difference of 0.010%), Israeli (96.3%, a difference of 0.010%), Albanian (96.3%, a difference of 0.010%), and Immigrants from Greece (96.3%, a difference of 0.020%).
| Demographics | Rating | Rank | 7th Grade |
| Jordanians | 90.0 /100 | #138 | Excellent 96.4% |
| Basques | 89.3 /100 | #139 | Excellent 96.4% |
| Cambodians | 88.3 /100 | #140 | Excellent 96.3% |
| Immigrants | South Central Asia | 87.1 /100 | #141 | Excellent 96.3% |
| Burmese | 87.1 /100 | #142 | Excellent 96.3% |
| Spanish | 86.6 /100 | #143 | Excellent 96.3% |
| Immigrants | Greece | 85.9 /100 | #144 | Excellent 96.3% |
| Blackfeet | 83.9 /100 | #145 | Excellent 96.3% |
| Immigrants | Eastern Europe | 83.7 /100 | #146 | Excellent 96.3% |
| French American Indians | 83.1 /100 | #147 | Excellent 96.3% |
| Israelis | 82.8 /100 | #148 | Excellent 96.3% |
| Albanians | 82.6 /100 | #149 | Excellent 96.3% |
| Immigrants | Belarus | 82.4 /100 | #150 | Excellent 96.3% |
| Hopi | 81.6 /100 | #151 | Excellent 96.3% |
| Immigrants | Russia | 78.4 /100 | #152 | Good 96.2% |