Japanese vs Osage 10th Grade
COMPARE
Japanese
Osage
10th Grade
10th Grade Comparison
Japanese
Osage
91.2%
10TH GRADE
0.0/ 100
METRIC RATING
301st/ 347
METRIC RANK
94.2%
10TH GRADE
91.7/ 100
METRIC RATING
134th/ 347
METRIC RANK
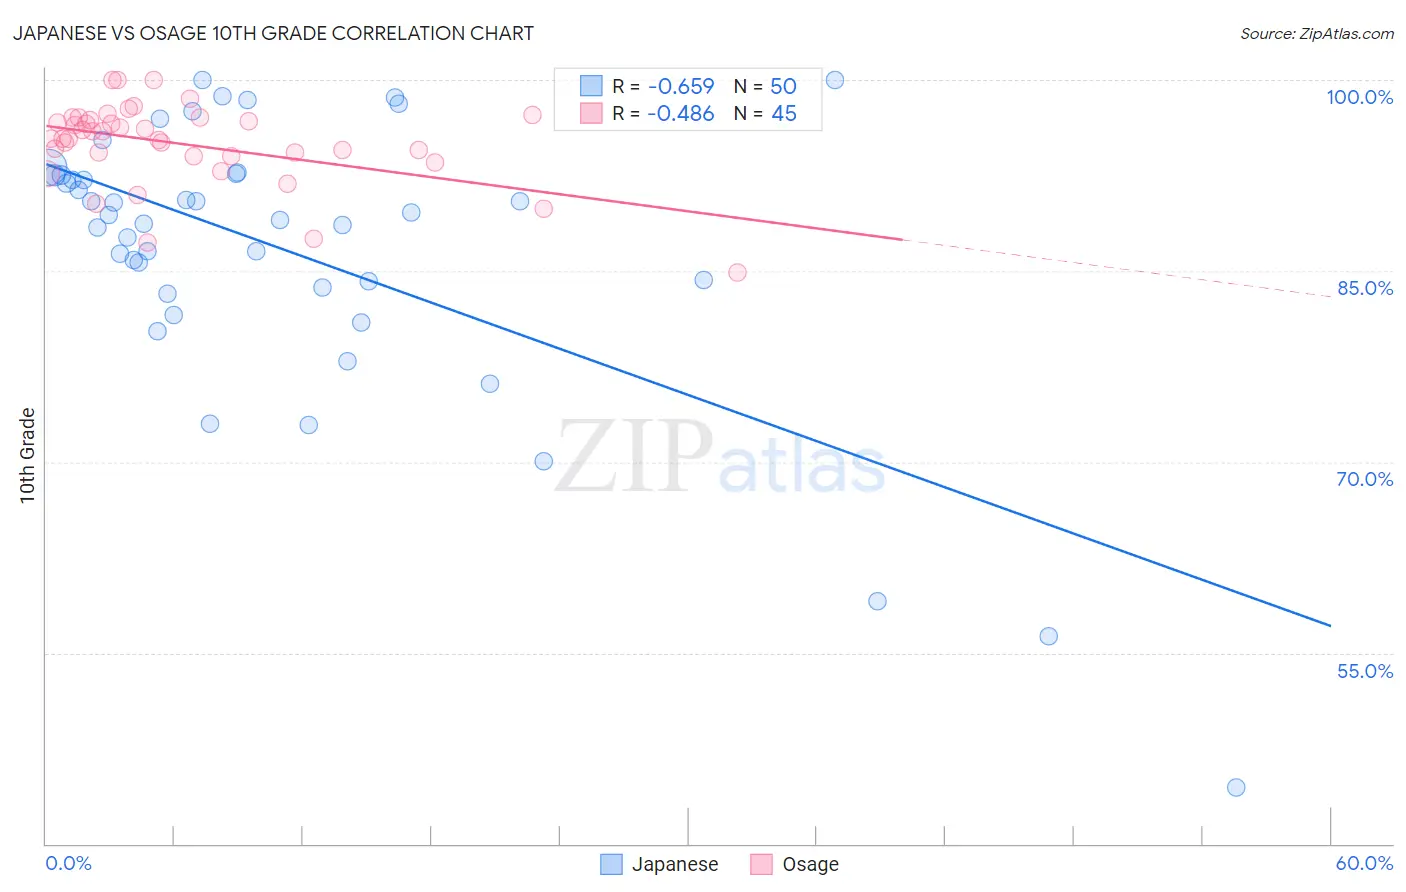
Japanese vs Osage 10th Grade Correlation Chart
The statistical analysis conducted on geographies consisting of 249,183,224 people shows a significant negative correlation between the proportion of Japanese and percentage of population with at least 10th grade education in the United States with a correlation coefficient (R) of -0.659 and weighted average of 91.2%. Similarly, the statistical analysis conducted on geographies consisting of 91,808,929 people shows a moderate negative correlation between the proportion of Osage and percentage of population with at least 10th grade education in the United States with a correlation coefficient (R) of -0.486 and weighted average of 94.2%, a difference of 3.3%.
10th Grade Correlation Summary
| Measurement | Japanese | Osage |
| Minimum | 44.4% | 84.9% |
| Maximum | 100.0% | 100.0% |
| Range | 55.6% | 15.1% |
| Mean | 86.5% | 95.0% |
| Median | 89.2% | 95.4% |
| Interquartile 25% (IQ1) | 83.7% | 94.0% |
| Interquartile 75% (IQ3) | 92.6% | 96.9% |
| Interquartile Range (IQR) | 8.9% | 2.9% |
| Standard Deviation (Sample) | 11.1% | 3.2% |
| Standard Deviation (Population) | 11.0% | 3.2% |
Similar Demographics by 10th Grade
Demographics Similar to Japanese by 10th Grade
In terms of 10th grade, the demographic groups most similar to Japanese are Immigrants from Guyana (91.2%, a difference of 0.010%), Immigrants from Vietnam (91.2%, a difference of 0.030%), Pima (91.2%, a difference of 0.080%), Immigrants from Dominica (91.1%, a difference of 0.10%), and Guyanese (91.4%, a difference of 0.15%).
| Demographics | Rating | Rank | 10th Grade |
| Haitians | 0.0 /100 | #294 | Tragic 91.8% |
| Lumbee | 0.0 /100 | #295 | Tragic 91.7% |
| Immigrants | Grenada | 0.0 /100 | #296 | Tragic 91.6% |
| Fijians | 0.0 /100 | #297 | Tragic 91.5% |
| Cubans | 0.0 /100 | #298 | Tragic 91.5% |
| Immigrants | Haiti | 0.0 /100 | #299 | Tragic 91.4% |
| Guyanese | 0.0 /100 | #300 | Tragic 91.4% |
| Japanese | 0.0 /100 | #301 | Tragic 91.2% |
| Immigrants | Guyana | 0.0 /100 | #302 | Tragic 91.2% |
| Immigrants | Vietnam | 0.0 /100 | #303 | Tragic 91.2% |
| Pima | 0.0 /100 | #304 | Tragic 91.2% |
| Immigrants | Dominica | 0.0 /100 | #305 | Tragic 91.1% |
| Yaqui | 0.0 /100 | #306 | Tragic 91.1% |
| Immigrants | Fiji | 0.0 /100 | #307 | Tragic 91.0% |
| Immigrants | Bangladesh | 0.0 /100 | #308 | Tragic 91.0% |
Demographics Similar to Osage by 10th Grade
In terms of 10th grade, the demographic groups most similar to Osage are Creek (94.2%, a difference of 0.010%), Immigrants from Korea (94.2%, a difference of 0.010%), Immigrants from Russia (94.3%, a difference of 0.020%), Iroquois (94.3%, a difference of 0.030%), and Immigrants from Greece (94.3%, a difference of 0.030%).
| Demographics | Rating | Rank | 10th Grade |
| Israelis | 93.8 /100 | #127 | Exceptional 94.3% |
| Potawatomi | 93.6 /100 | #128 | Exceptional 94.3% |
| Iroquois | 92.8 /100 | #129 | Exceptional 94.3% |
| Immigrants | Greece | 92.7 /100 | #130 | Exceptional 94.3% |
| Immigrants | Eastern Europe | 92.5 /100 | #131 | Exceptional 94.3% |
| Immigrants | Russia | 92.4 /100 | #132 | Exceptional 94.3% |
| Creek | 91.9 /100 | #133 | Exceptional 94.2% |
| Osage | 91.7 /100 | #134 | Exceptional 94.2% |
| Immigrants | Korea | 91.3 /100 | #135 | Exceptional 94.2% |
| Shoshone | 90.8 /100 | #136 | Exceptional 94.2% |
| Arapaho | 90.5 /100 | #137 | Exceptional 94.2% |
| Immigrants | Sri Lanka | 89.9 /100 | #138 | Excellent 94.2% |
| Immigrants | Bosnia and Herzegovina | 89.4 /100 | #139 | Excellent 94.2% |
| Immigrants | Jordan | 87.6 /100 | #140 | Excellent 94.1% |
| Hmong | 86.6 /100 | #141 | Excellent 94.1% |