Japanese vs Chippewa 10th Grade
COMPARE
Japanese
Chippewa
10th Grade
10th Grade Comparison
Japanese
Chippewa
91.2%
10TH GRADE
0.0/ 100
METRIC RATING
301st/ 347
METRIC RANK
95.0%
10TH GRADE
99.8/ 100
METRIC RATING
61st/ 347
METRIC RANK
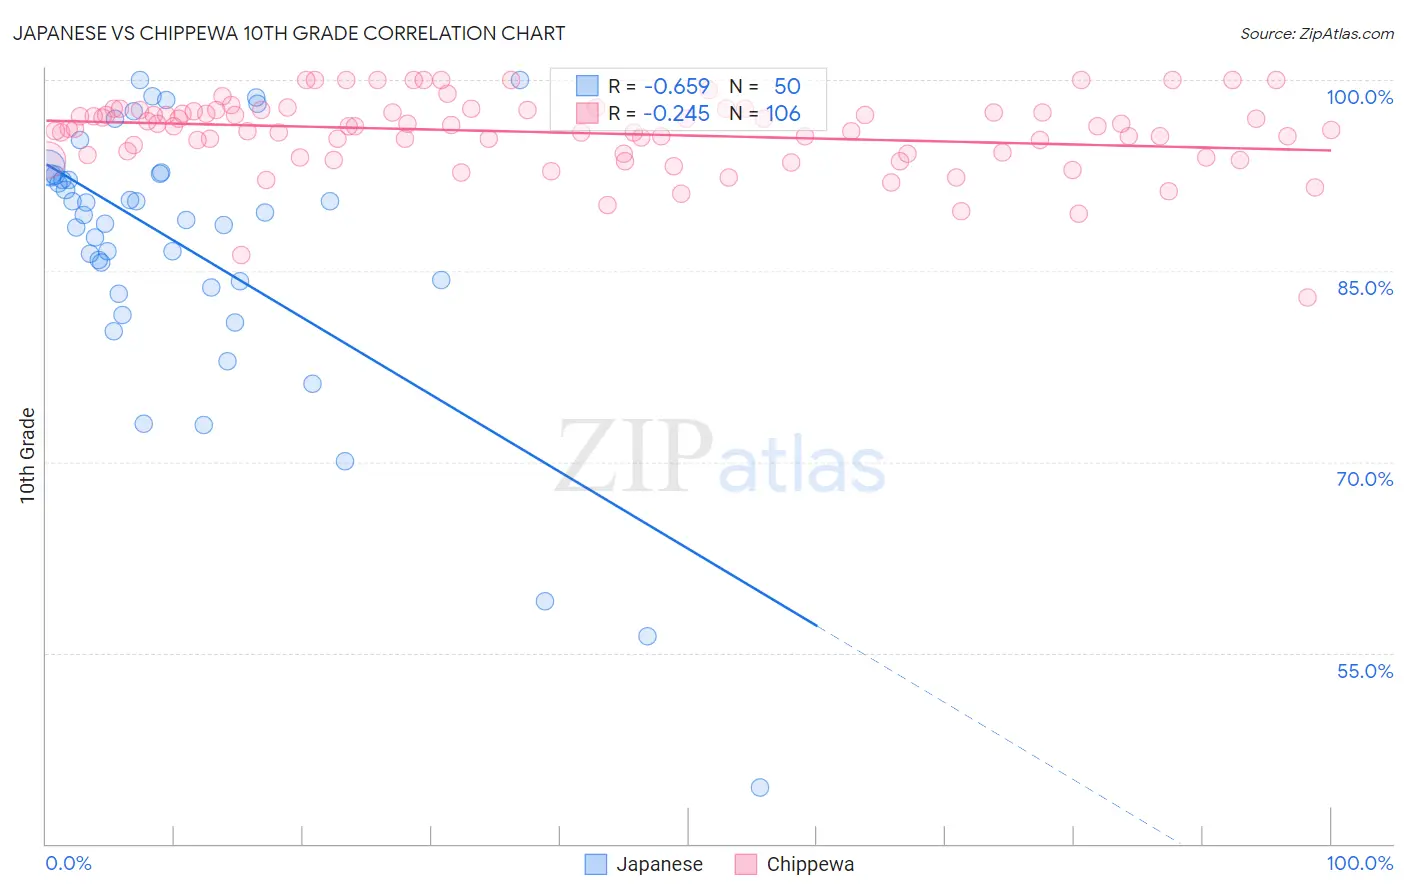
Japanese vs Chippewa 10th Grade Correlation Chart
The statistical analysis conducted on geographies consisting of 249,183,224 people shows a significant negative correlation between the proportion of Japanese and percentage of population with at least 10th grade education in the United States with a correlation coefficient (R) of -0.659 and weighted average of 91.2%. Similarly, the statistical analysis conducted on geographies consisting of 215,067,289 people shows a weak negative correlation between the proportion of Chippewa and percentage of population with at least 10th grade education in the United States with a correlation coefficient (R) of -0.245 and weighted average of 95.0%, a difference of 4.1%.
10th Grade Correlation Summary
| Measurement | Japanese | Chippewa |
| Minimum | 44.4% | 82.9% |
| Maximum | 100.0% | 100.0% |
| Range | 55.6% | 17.1% |
| Mean | 86.5% | 95.9% |
| Median | 89.2% | 96.4% |
| Interquartile 25% (IQ1) | 83.7% | 94.2% |
| Interquartile 75% (IQ3) | 92.6% | 97.6% |
| Interquartile Range (IQR) | 8.9% | 3.4% |
| Standard Deviation (Sample) | 11.1% | 2.9% |
| Standard Deviation (Population) | 11.0% | 2.9% |
Similar Demographics by 10th Grade
Demographics Similar to Japanese by 10th Grade
In terms of 10th grade, the demographic groups most similar to Japanese are Immigrants from Guyana (91.2%, a difference of 0.010%), Immigrants from Vietnam (91.2%, a difference of 0.030%), Pima (91.2%, a difference of 0.080%), Immigrants from Dominica (91.1%, a difference of 0.10%), and Guyanese (91.4%, a difference of 0.15%).
| Demographics | Rating | Rank | 10th Grade |
| Haitians | 0.0 /100 | #294 | Tragic 91.8% |
| Lumbee | 0.0 /100 | #295 | Tragic 91.7% |
| Immigrants | Grenada | 0.0 /100 | #296 | Tragic 91.6% |
| Fijians | 0.0 /100 | #297 | Tragic 91.5% |
| Cubans | 0.0 /100 | #298 | Tragic 91.5% |
| Immigrants | Haiti | 0.0 /100 | #299 | Tragic 91.4% |
| Guyanese | 0.0 /100 | #300 | Tragic 91.4% |
| Japanese | 0.0 /100 | #301 | Tragic 91.2% |
| Immigrants | Guyana | 0.0 /100 | #302 | Tragic 91.2% |
| Immigrants | Vietnam | 0.0 /100 | #303 | Tragic 91.2% |
| Pima | 0.0 /100 | #304 | Tragic 91.2% |
| Immigrants | Dominica | 0.0 /100 | #305 | Tragic 91.1% |
| Yaqui | 0.0 /100 | #306 | Tragic 91.1% |
| Immigrants | Fiji | 0.0 /100 | #307 | Tragic 91.0% |
| Immigrants | Bangladesh | 0.0 /100 | #308 | Tragic 91.0% |
Demographics Similar to Chippewa by 10th Grade
In terms of 10th grade, the demographic groups most similar to Chippewa are Cypriot (95.0%, a difference of 0.0%), Aleut (95.0%, a difference of 0.010%), Celtic (95.0%, a difference of 0.010%), Thai (95.0%, a difference of 0.010%), and Immigrants from Singapore (95.0%, a difference of 0.010%).
| Demographics | Rating | Rank | 10th Grade |
| Immigrants | Lithuania | 99.8 /100 | #54 | Exceptional 95.0% |
| Immigrants | Ireland | 99.8 /100 | #55 | Exceptional 95.0% |
| New Zealanders | 99.8 /100 | #56 | Exceptional 95.0% |
| Ukrainians | 99.8 /100 | #57 | Exceptional 95.0% |
| Aleuts | 99.8 /100 | #58 | Exceptional 95.0% |
| Celtics | 99.8 /100 | #59 | Exceptional 95.0% |
| Cypriots | 99.8 /100 | #60 | Exceptional 95.0% |
| Chippewa | 99.8 /100 | #61 | Exceptional 95.0% |
| Thais | 99.8 /100 | #62 | Exceptional 95.0% |
| Immigrants | Singapore | 99.8 /100 | #63 | Exceptional 95.0% |
| Native Hawaiians | 99.7 /100 | #64 | Exceptional 95.0% |
| Turks | 99.7 /100 | #65 | Exceptional 95.0% |
| Immigrants | Australia | 99.7 /100 | #66 | Exceptional 94.9% |
| Immigrants | Netherlands | 99.7 /100 | #67 | Exceptional 94.9% |
| Immigrants | Belgium | 99.7 /100 | #68 | Exceptional 94.9% |