Honduran vs Immigrants from Albania Bachelor's Degree
COMPARE
Honduran
Immigrants from Albania
Bachelor's Degree
Bachelor's Degree Comparison
Hondurans
Immigrants from Albania
31.3%
BACHELOR'S DEGREE
0.1/ 100
METRIC RATING
283rd/ 347
METRIC RANK
40.4%
BACHELOR'S DEGREE
94.4/ 100
METRIC RATING
122nd/ 347
METRIC RANK
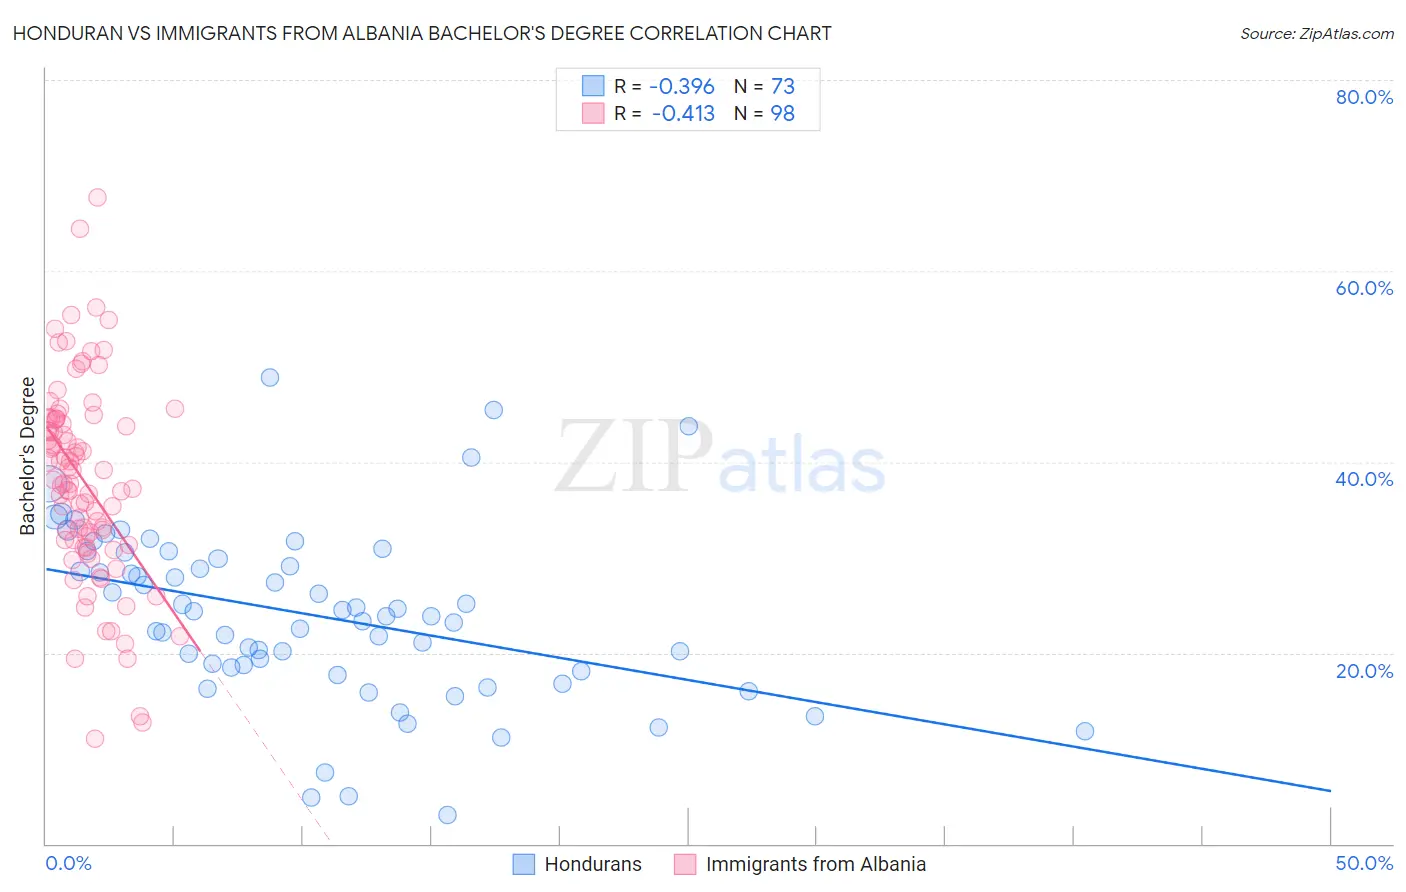
Honduran vs Immigrants from Albania Bachelor's Degree Correlation Chart
The statistical analysis conducted on geographies consisting of 357,779,411 people shows a mild negative correlation between the proportion of Hondurans and percentage of population with at least bachelor's degree education in the United States with a correlation coefficient (R) of -0.396 and weighted average of 31.3%. Similarly, the statistical analysis conducted on geographies consisting of 119,391,185 people shows a moderate negative correlation between the proportion of Immigrants from Albania and percentage of population with at least bachelor's degree education in the United States with a correlation coefficient (R) of -0.413 and weighted average of 40.4%, a difference of 29.0%.
Bachelor's Degree Correlation Summary
| Measurement | Honduran | Immigrants from Albania |
| Minimum | 3.0% | 11.0% |
| Maximum | 48.9% | 67.7% |
| Range | 45.9% | 56.7% |
| Mean | 24.0% | 37.9% |
| Median | 23.9% | 37.9% |
| Interquartile 25% (IQ1) | 18.3% | 31.8% |
| Interquartile 75% (IQ3) | 30.2% | 44.5% |
| Interquartile Range (IQR) | 11.9% | 12.7% |
| Standard Deviation (Sample) | 9.1% | 10.4% |
| Standard Deviation (Population) | 9.0% | 10.4% |
Similar Demographics by Bachelor's Degree
Demographics Similar to Hondurans by Bachelor's Degree
In terms of bachelor's degree, the demographic groups most similar to Hondurans are Haitian (31.3%, a difference of 0.030%), Aleut (31.3%, a difference of 0.040%), Immigrants from El Salvador (31.3%, a difference of 0.10%), Immigrants from Caribbean (31.4%, a difference of 0.28%), and Blackfeet (31.5%, a difference of 0.42%).
| Demographics | Rating | Rank | Bachelor's Degree |
| Salvadorans | 0.1 /100 | #276 | Tragic 31.8% |
| Dominicans | 0.1 /100 | #277 | Tragic 31.8% |
| Marshallese | 0.1 /100 | #278 | Tragic 31.7% |
| Hawaiians | 0.1 /100 | #279 | Tragic 31.6% |
| Immigrants | Laos | 0.1 /100 | #280 | Tragic 31.6% |
| Blackfeet | 0.1 /100 | #281 | Tragic 31.5% |
| Immigrants | Caribbean | 0.1 /100 | #282 | Tragic 31.4% |
| Hondurans | 0.1 /100 | #283 | Tragic 31.3% |
| Haitians | 0.1 /100 | #284 | Tragic 31.3% |
| Aleuts | 0.1 /100 | #285 | Tragic 31.3% |
| Immigrants | El Salvador | 0.1 /100 | #286 | Tragic 31.3% |
| Ottawa | 0.1 /100 | #287 | Tragic 31.1% |
| Guatemalans | 0.1 /100 | #288 | Tragic 31.0% |
| Puerto Ricans | 0.1 /100 | #289 | Tragic 31.0% |
| Immigrants | Honduras | 0.1 /100 | #290 | Tragic 30.9% |
Demographics Similar to Immigrants from Albania by Bachelor's Degree
In terms of bachelor's degree, the demographic groups most similar to Immigrants from Albania are Lebanese (40.4%, a difference of 0.020%), Immigrants from Eritrea (40.4%, a difference of 0.020%), British (40.4%, a difference of 0.060%), Moroccan (40.5%, a difference of 0.10%), and Immigrants from Eastern Africa (40.4%, a difference of 0.10%).
| Demographics | Rating | Rank | Bachelor's Degree |
| Palestinians | 95.8 /100 | #115 | Exceptional 40.7% |
| Immigrants | Uganda | 95.7 /100 | #116 | Exceptional 40.7% |
| Austrians | 95.5 /100 | #117 | Exceptional 40.6% |
| Croatians | 95.5 /100 | #118 | Exceptional 40.6% |
| Immigrants | Syria | 94.9 /100 | #119 | Exceptional 40.5% |
| Venezuelans | 94.7 /100 | #120 | Exceptional 40.5% |
| Moroccans | 94.6 /100 | #121 | Exceptional 40.5% |
| Immigrants | Albania | 94.4 /100 | #122 | Exceptional 40.4% |
| Lebanese | 94.3 /100 | #123 | Exceptional 40.4% |
| Immigrants | Eritrea | 94.3 /100 | #124 | Exceptional 40.4% |
| British | 94.2 /100 | #125 | Exceptional 40.4% |
| Immigrants | Eastern Africa | 94.1 /100 | #126 | Exceptional 40.4% |
| Immigrants | Jordan | 93.4 /100 | #127 | Exceptional 40.3% |
| Immigrants | Venezuela | 92.9 /100 | #128 | Exceptional 40.2% |
| Serbians | 92.4 /100 | #129 | Exceptional 40.1% |