Immigrants from South Africa vs Immigrants from Albania Bachelor's Degree
COMPARE
Immigrants from South Africa
Immigrants from Albania
Bachelor's Degree
Bachelor's Degree Comparison
Immigrants from South Africa
Immigrants from Albania
44.8%
BACHELOR'S DEGREE
99.9/ 100
METRIC RATING
43rd/ 347
METRIC RANK
40.4%
BACHELOR'S DEGREE
94.4/ 100
METRIC RATING
122nd/ 347
METRIC RANK
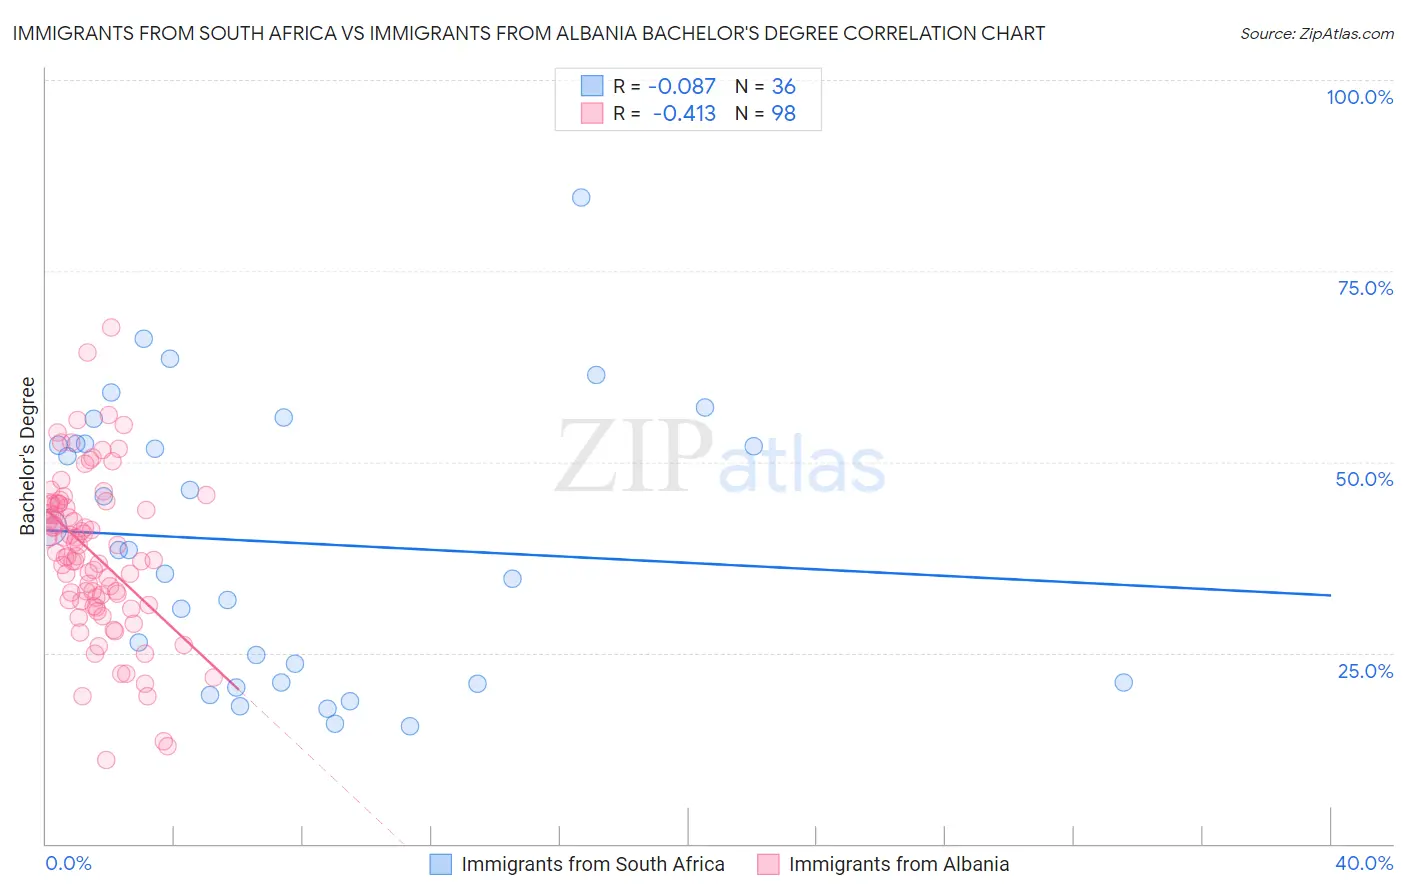
Immigrants from South Africa vs Immigrants from Albania Bachelor's Degree Correlation Chart
The statistical analysis conducted on geographies consisting of 233,310,486 people shows a slight negative correlation between the proportion of Immigrants from South Africa and percentage of population with at least bachelor's degree education in the United States with a correlation coefficient (R) of -0.087 and weighted average of 44.8%. Similarly, the statistical analysis conducted on geographies consisting of 119,391,185 people shows a moderate negative correlation between the proportion of Immigrants from Albania and percentage of population with at least bachelor's degree education in the United States with a correlation coefficient (R) of -0.413 and weighted average of 40.4%, a difference of 10.8%.
Bachelor's Degree Correlation Summary
| Measurement | Immigrants from South Africa | Immigrants from Albania |
| Minimum | 15.4% | 11.0% |
| Maximum | 84.6% | 67.7% |
| Range | 69.2% | 56.7% |
| Mean | 39.5% | 37.9% |
| Median | 38.5% | 37.9% |
| Interquartile 25% (IQ1) | 21.1% | 31.8% |
| Interquartile 75% (IQ3) | 52.4% | 44.5% |
| Interquartile Range (IQR) | 31.3% | 12.7% |
| Standard Deviation (Sample) | 17.9% | 10.4% |
| Standard Deviation (Population) | 17.6% | 10.4% |
Similar Demographics by Bachelor's Degree
Demographics Similar to Immigrants from South Africa by Bachelor's Degree
In terms of bachelor's degree, the demographic groups most similar to Immigrants from South Africa are Immigrants from Saudi Arabia (44.8%, a difference of 0.14%), Immigrants from Lithuania (44.6%, a difference of 0.35%), Immigrants from Kuwait (44.6%, a difference of 0.38%), Immigrants from Bulgaria (44.6%, a difference of 0.44%), and Bolivian (44.6%, a difference of 0.48%).
| Demographics | Rating | Rank | Bachelor's Degree |
| Mongolians | 100.0 /100 | #36 | Exceptional 45.4% |
| Russians | 100.0 /100 | #37 | Exceptional 45.3% |
| Bulgarians | 100.0 /100 | #38 | Exceptional 45.3% |
| Immigrants | Latvia | 100.0 /100 | #39 | Exceptional 45.1% |
| Immigrants | Belarus | 100.0 /100 | #40 | Exceptional 45.0% |
| Immigrants | Malaysia | 100.0 /100 | #41 | Exceptional 45.0% |
| Immigrants | Saudi Arabia | 100.0 /100 | #42 | Exceptional 44.8% |
| Immigrants | South Africa | 99.9 /100 | #43 | Exceptional 44.8% |
| Immigrants | Lithuania | 99.9 /100 | #44 | Exceptional 44.6% |
| Immigrants | Kuwait | 99.9 /100 | #45 | Exceptional 44.6% |
| Immigrants | Bulgaria | 99.9 /100 | #46 | Exceptional 44.6% |
| Bolivians | 99.9 /100 | #47 | Exceptional 44.6% |
| Estonians | 99.9 /100 | #48 | Exceptional 44.6% |
| Immigrants | Norway | 99.9 /100 | #49 | Exceptional 44.5% |
| Immigrants | Greece | 99.9 /100 | #50 | Exceptional 44.5% |
Demographics Similar to Immigrants from Albania by Bachelor's Degree
In terms of bachelor's degree, the demographic groups most similar to Immigrants from Albania are Lebanese (40.4%, a difference of 0.020%), Immigrants from Eritrea (40.4%, a difference of 0.020%), British (40.4%, a difference of 0.060%), Moroccan (40.5%, a difference of 0.10%), and Immigrants from Eastern Africa (40.4%, a difference of 0.10%).
| Demographics | Rating | Rank | Bachelor's Degree |
| Palestinians | 95.8 /100 | #115 | Exceptional 40.7% |
| Immigrants | Uganda | 95.7 /100 | #116 | Exceptional 40.7% |
| Austrians | 95.5 /100 | #117 | Exceptional 40.6% |
| Croatians | 95.5 /100 | #118 | Exceptional 40.6% |
| Immigrants | Syria | 94.9 /100 | #119 | Exceptional 40.5% |
| Venezuelans | 94.7 /100 | #120 | Exceptional 40.5% |
| Moroccans | 94.6 /100 | #121 | Exceptional 40.5% |
| Immigrants | Albania | 94.4 /100 | #122 | Exceptional 40.4% |
| Lebanese | 94.3 /100 | #123 | Exceptional 40.4% |
| Immigrants | Eritrea | 94.3 /100 | #124 | Exceptional 40.4% |
| British | 94.2 /100 | #125 | Exceptional 40.4% |
| Immigrants | Eastern Africa | 94.1 /100 | #126 | Exceptional 40.4% |
| Immigrants | Jordan | 93.4 /100 | #127 | Exceptional 40.3% |
| Immigrants | Venezuela | 92.9 /100 | #128 | Exceptional 40.2% |
| Serbians | 92.4 /100 | #129 | Exceptional 40.1% |