Immigrants from Armenia vs Immigrants from Albania Bachelor's Degree
COMPARE
Immigrants from Armenia
Immigrants from Albania
Bachelor's Degree
Bachelor's Degree Comparison
Immigrants from Armenia
Immigrants from Albania
39.4%
BACHELOR'S DEGREE
84.1/ 100
METRIC RATING
140th/ 347
METRIC RANK
40.4%
BACHELOR'S DEGREE
94.4/ 100
METRIC RATING
122nd/ 347
METRIC RANK
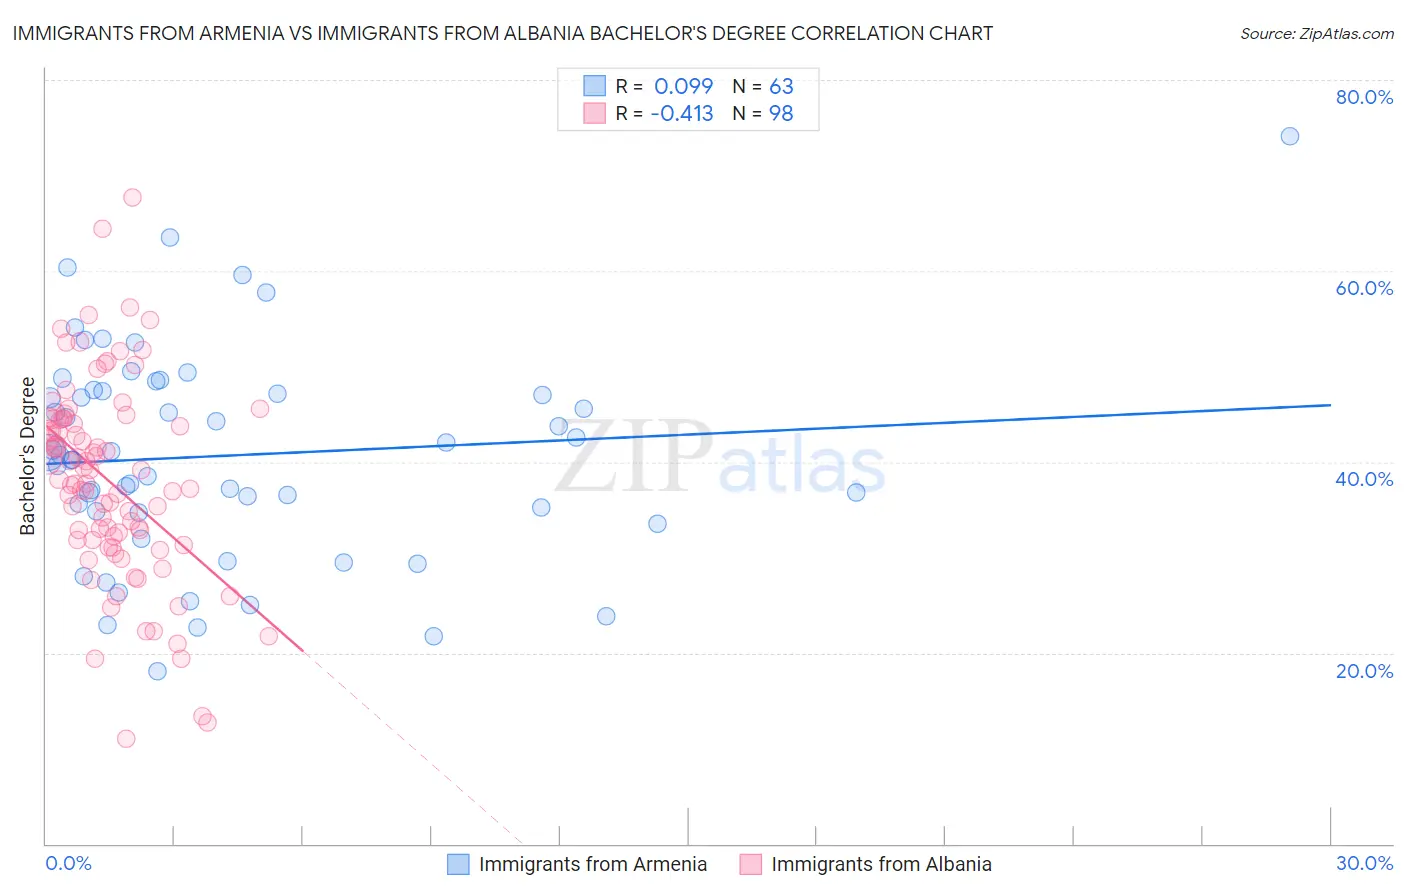
Immigrants from Armenia vs Immigrants from Albania Bachelor's Degree Correlation Chart
The statistical analysis conducted on geographies consisting of 97,721,630 people shows a slight positive correlation between the proportion of Immigrants from Armenia and percentage of population with at least bachelor's degree education in the United States with a correlation coefficient (R) of 0.099 and weighted average of 39.4%. Similarly, the statistical analysis conducted on geographies consisting of 119,391,185 people shows a moderate negative correlation between the proportion of Immigrants from Albania and percentage of population with at least bachelor's degree education in the United States with a correlation coefficient (R) of -0.413 and weighted average of 40.4%, a difference of 2.7%.
Bachelor's Degree Correlation Summary
| Measurement | Immigrants from Armenia | Immigrants from Albania |
| Minimum | 18.0% | 11.0% |
| Maximum | 74.1% | 67.7% |
| Range | 56.1% | 56.7% |
| Mean | 40.7% | 37.9% |
| Median | 40.7% | 37.9% |
| Interquartile 25% (IQ1) | 34.7% | 31.8% |
| Interquartile 75% (IQ3) | 47.3% | 44.5% |
| Interquartile Range (IQR) | 12.6% | 12.7% |
| Standard Deviation (Sample) | 11.0% | 10.4% |
| Standard Deviation (Population) | 10.9% | 10.4% |
Demographics Similar to Immigrants from Armenia and Immigrants from Albania by Bachelor's Degree
In terms of bachelor's degree, the demographic groups most similar to Immigrants from Armenia are Immigrants from Sudan (39.4%, a difference of 0.070%), South American Indian (39.3%, a difference of 0.090%), European (39.5%, a difference of 0.27%), Icelander (39.5%, a difference of 0.44%), and Pakistani (39.7%, a difference of 0.81%). Similarly, the demographic groups most similar to Immigrants from Albania are Lebanese (40.4%, a difference of 0.020%), Immigrants from Eritrea (40.4%, a difference of 0.020%), British (40.4%, a difference of 0.060%), Moroccan (40.5%, a difference of 0.10%), and Immigrants from Eastern Africa (40.4%, a difference of 0.10%).
| Demographics | Rating | Rank | Bachelor's Degree |
| Moroccans | 94.6 /100 | #121 | Exceptional 40.5% |
| Immigrants | Albania | 94.4 /100 | #122 | Exceptional 40.4% |
| Lebanese | 94.3 /100 | #123 | Exceptional 40.4% |
| Immigrants | Eritrea | 94.3 /100 | #124 | Exceptional 40.4% |
| British | 94.2 /100 | #125 | Exceptional 40.4% |
| Immigrants | Eastern Africa | 94.1 /100 | #126 | Exceptional 40.4% |
| Immigrants | Jordan | 93.4 /100 | #127 | Exceptional 40.3% |
| Immigrants | Venezuela | 92.9 /100 | #128 | Exceptional 40.2% |
| Serbians | 92.4 /100 | #129 | Exceptional 40.1% |
| Sierra Leoneans | 92.2 /100 | #130 | Exceptional 40.1% |
| Italians | 91.9 /100 | #131 | Exceptional 40.1% |
| Taiwanese | 91.1 /100 | #132 | Exceptional 40.0% |
| Immigrants | Southern Europe | 91.1 /100 | #133 | Exceptional 40.0% |
| Assyrians/Chaldeans/Syriacs | 89.4 /100 | #134 | Excellent 39.8% |
| Luxembourgers | 89.1 /100 | #135 | Excellent 39.8% |
| Pakistanis | 88.2 /100 | #136 | Excellent 39.7% |
| Icelanders | 86.5 /100 | #137 | Excellent 39.5% |
| Europeans | 85.6 /100 | #138 | Excellent 39.5% |
| Immigrants | Sudan | 84.5 /100 | #139 | Excellent 39.4% |
| Immigrants | Armenia | 84.1 /100 | #140 | Excellent 39.4% |
| South American Indians | 83.6 /100 | #141 | Excellent 39.3% |