Immigrants from Zimbabwe vs Immigrants from Albania Bachelor's Degree
COMPARE
Immigrants from Zimbabwe
Immigrants from Albania
Bachelor's Degree
Bachelor's Degree Comparison
Immigrants from Zimbabwe
Immigrants from Albania
42.6%
BACHELOR'S DEGREE
99.4/ 100
METRIC RATING
75th/ 347
METRIC RANK
40.4%
BACHELOR'S DEGREE
94.4/ 100
METRIC RATING
122nd/ 347
METRIC RANK
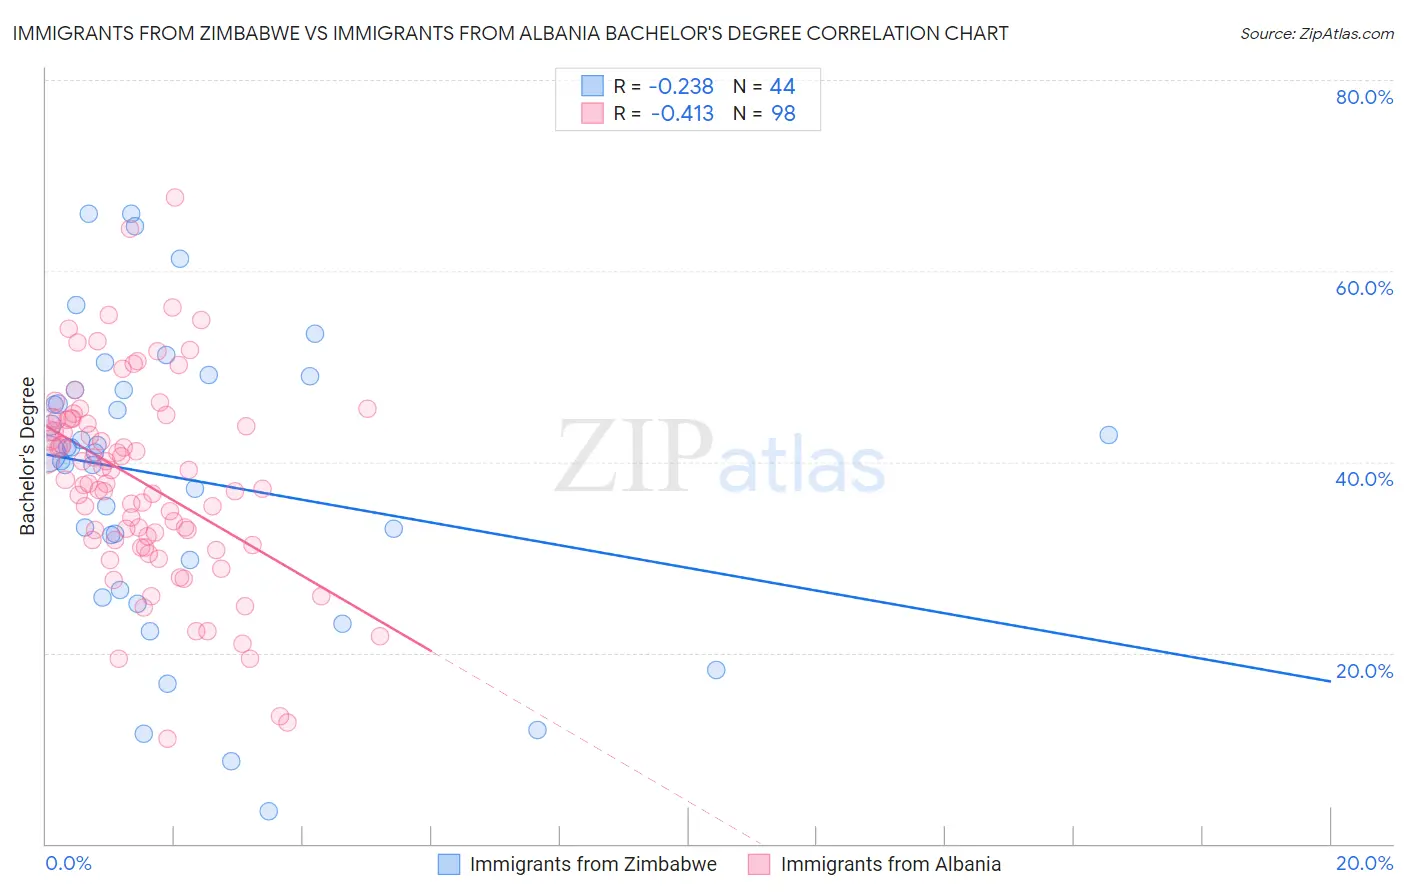
Immigrants from Zimbabwe vs Immigrants from Albania Bachelor's Degree Correlation Chart
The statistical analysis conducted on geographies consisting of 117,809,864 people shows a weak negative correlation between the proportion of Immigrants from Zimbabwe and percentage of population with at least bachelor's degree education in the United States with a correlation coefficient (R) of -0.238 and weighted average of 42.6%. Similarly, the statistical analysis conducted on geographies consisting of 119,391,185 people shows a moderate negative correlation between the proportion of Immigrants from Albania and percentage of population with at least bachelor's degree education in the United States with a correlation coefficient (R) of -0.413 and weighted average of 40.4%, a difference of 5.3%.
Bachelor's Degree Correlation Summary
| Measurement | Immigrants from Zimbabwe | Immigrants from Albania |
| Minimum | 3.5% | 11.0% |
| Maximum | 66.0% | 67.7% |
| Range | 62.5% | 56.7% |
| Mean | 38.2% | 37.9% |
| Median | 40.9% | 37.9% |
| Interquartile 25% (IQ1) | 28.1% | 31.8% |
| Interquartile 75% (IQ3) | 47.5% | 44.5% |
| Interquartile Range (IQR) | 19.4% | 12.7% |
| Standard Deviation (Sample) | 15.1% | 10.4% |
| Standard Deviation (Population) | 15.0% | 10.4% |
Similar Demographics by Bachelor's Degree
Demographics Similar to Immigrants from Zimbabwe by Bachelor's Degree
In terms of bachelor's degree, the demographic groups most similar to Immigrants from Zimbabwe are Immigrants from Egypt (42.6%, a difference of 0.020%), Immigrants from Eastern Europe (42.5%, a difference of 0.20%), Bhutanese (42.7%, a difference of 0.21%), Immigrants from Ethiopia (42.5%, a difference of 0.26%), and Immigrants from Lebanon (42.4%, a difference of 0.42%).
| Demographics | Rating | Rank | Bachelor's Degree |
| Immigrants | Indonesia | 99.7 /100 | #68 | Exceptional 43.3% |
| Immigrants | Pakistan | 99.7 /100 | #69 | Exceptional 43.1% |
| Immigrants | Romania | 99.6 /100 | #70 | Exceptional 42.9% |
| Immigrants | Argentina | 99.6 /100 | #71 | Exceptional 42.8% |
| Ethiopians | 99.5 /100 | #72 | Exceptional 42.8% |
| Immigrants | Uzbekistan | 99.5 /100 | #73 | Exceptional 42.8% |
| Bhutanese | 99.5 /100 | #74 | Exceptional 42.7% |
| Immigrants | Zimbabwe | 99.4 /100 | #75 | Exceptional 42.6% |
| Immigrants | Egypt | 99.4 /100 | #76 | Exceptional 42.6% |
| Immigrants | Eastern Europe | 99.4 /100 | #77 | Exceptional 42.5% |
| Immigrants | Ethiopia | 99.4 /100 | #78 | Exceptional 42.5% |
| Immigrants | Lebanon | 99.3 /100 | #79 | Exceptional 42.4% |
| Immigrants | Croatia | 99.2 /100 | #80 | Exceptional 42.3% |
| Immigrants | Hungary | 99.2 /100 | #81 | Exceptional 42.3% |
| Immigrants | Scotland | 99.2 /100 | #82 | Exceptional 42.3% |
Demographics Similar to Immigrants from Albania by Bachelor's Degree
In terms of bachelor's degree, the demographic groups most similar to Immigrants from Albania are Lebanese (40.4%, a difference of 0.020%), Immigrants from Eritrea (40.4%, a difference of 0.020%), British (40.4%, a difference of 0.060%), Moroccan (40.5%, a difference of 0.10%), and Immigrants from Eastern Africa (40.4%, a difference of 0.10%).
| Demographics | Rating | Rank | Bachelor's Degree |
| Palestinians | 95.8 /100 | #115 | Exceptional 40.7% |
| Immigrants | Uganda | 95.7 /100 | #116 | Exceptional 40.7% |
| Austrians | 95.5 /100 | #117 | Exceptional 40.6% |
| Croatians | 95.5 /100 | #118 | Exceptional 40.6% |
| Immigrants | Syria | 94.9 /100 | #119 | Exceptional 40.5% |
| Venezuelans | 94.7 /100 | #120 | Exceptional 40.5% |
| Moroccans | 94.6 /100 | #121 | Exceptional 40.5% |
| Immigrants | Albania | 94.4 /100 | #122 | Exceptional 40.4% |
| Lebanese | 94.3 /100 | #123 | Exceptional 40.4% |
| Immigrants | Eritrea | 94.3 /100 | #124 | Exceptional 40.4% |
| British | 94.2 /100 | #125 | Exceptional 40.4% |
| Immigrants | Eastern Africa | 94.1 /100 | #126 | Exceptional 40.4% |
| Immigrants | Jordan | 93.4 /100 | #127 | Exceptional 40.3% |
| Immigrants | Venezuela | 92.9 /100 | #128 | Exceptional 40.2% |
| Serbians | 92.4 /100 | #129 | Exceptional 40.1% |