Jamaican vs Vietnamese Bachelor's Degree
COMPARE
Jamaican
Vietnamese
Bachelor's Degree
Bachelor's Degree Comparison
Jamaicans
Vietnamese
33.6%
BACHELOR'S DEGREE
1.0/ 100
METRIC RATING
246th/ 347
METRIC RANK
38.5%
BACHELOR'S DEGREE
66.6/ 100
METRIC RATING
160th/ 347
METRIC RANK
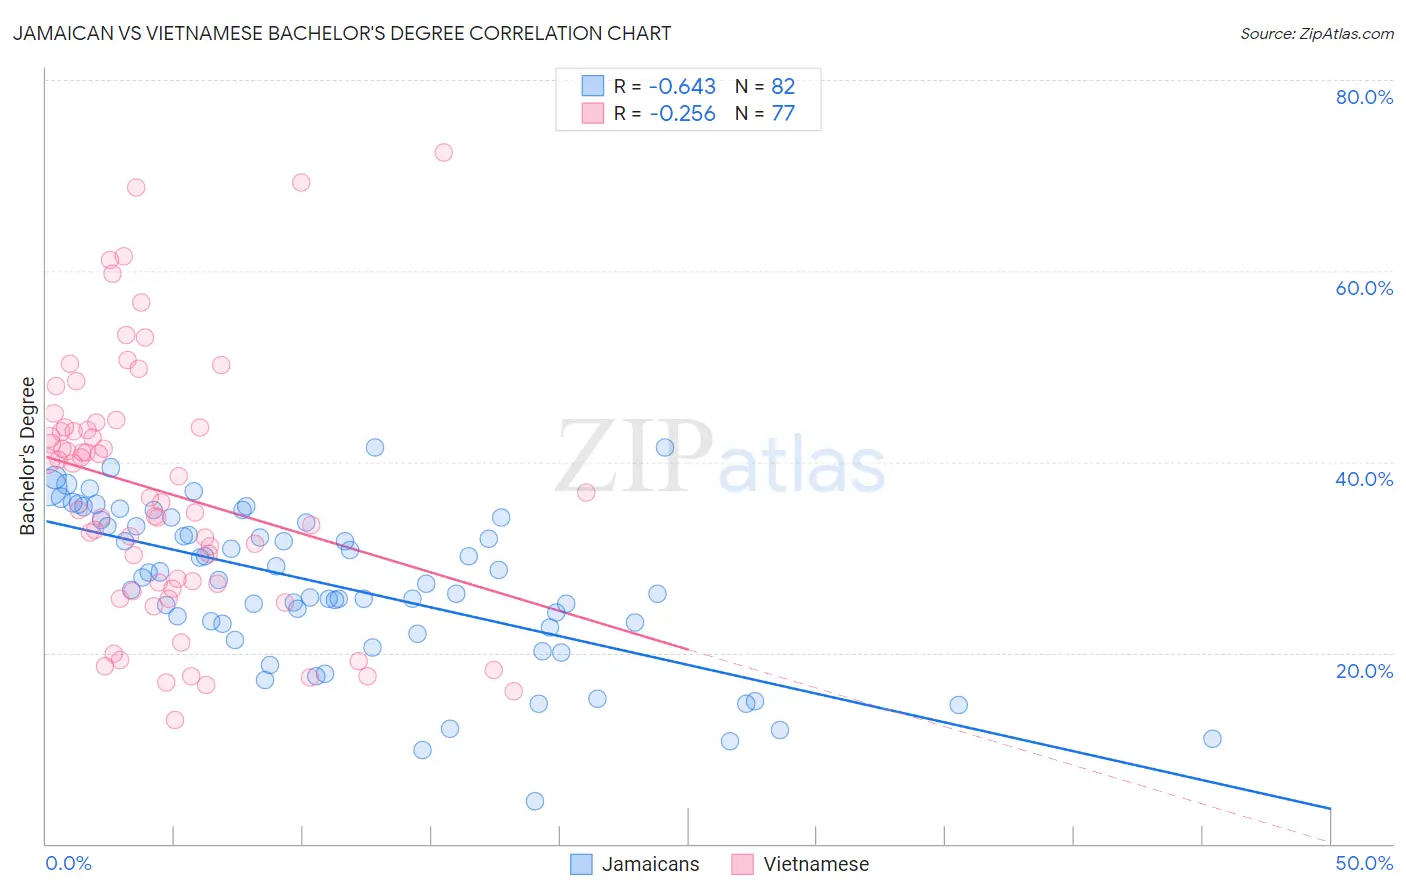
Jamaican vs Vietnamese Bachelor's Degree Correlation Chart
The statistical analysis conducted on geographies consisting of 368,011,400 people shows a significant negative correlation between the proportion of Jamaicans and percentage of population with at least bachelor's degree education in the United States with a correlation coefficient (R) of -0.643 and weighted average of 33.6%. Similarly, the statistical analysis conducted on geographies consisting of 170,741,328 people shows a weak negative correlation between the proportion of Vietnamese and percentage of population with at least bachelor's degree education in the United States with a correlation coefficient (R) of -0.256 and weighted average of 38.5%, a difference of 14.4%.
Bachelor's Degree Correlation Summary
| Measurement | Jamaican | Vietnamese |
| Minimum | 4.5% | 13.0% |
| Maximum | 41.5% | 72.4% |
| Range | 37.0% | 59.4% |
| Mean | 27.0% | 36.9% |
| Median | 27.5% | 36.3% |
| Interquartile 25% (IQ1) | 22.7% | 27.0% |
| Interquartile 75% (IQ3) | 33.7% | 43.6% |
| Interquartile Range (IQR) | 11.0% | 16.6% |
| Standard Deviation (Sample) | 8.2% | 13.4% |
| Standard Deviation (Population) | 8.1% | 13.3% |
Similar Demographics by Bachelor's Degree
Demographics Similar to Jamaicans by Bachelor's Degree
In terms of bachelor's degree, the demographic groups most similar to Jamaicans are Immigrants from Congo (33.6%, a difference of 0.090%), Cree (33.6%, a difference of 0.10%), Immigrants from Liberia (33.5%, a difference of 0.23%), Indonesian (33.5%, a difference of 0.24%), and Immigrants from Fiji (33.7%, a difference of 0.36%).
| Demographics | Rating | Rank | Bachelor's Degree |
| British West Indians | 2.5 /100 | #239 | Tragic 34.5% |
| Tongans | 2.0 /100 | #240 | Tragic 34.3% |
| Immigrants | Cambodia | 1.9 /100 | #241 | Tragic 34.2% |
| Immigrants | Nonimmigrants | 1.8 /100 | #242 | Tragic 34.2% |
| Immigrants | Guyana | 1.4 /100 | #243 | Tragic 33.9% |
| Delaware | 1.2 /100 | #244 | Tragic 33.8% |
| Immigrants | Fiji | 1.2 /100 | #245 | Tragic 33.7% |
| Jamaicans | 1.0 /100 | #246 | Tragic 33.6% |
| Immigrants | Congo | 1.0 /100 | #247 | Tragic 33.6% |
| Cree | 1.0 /100 | #248 | Tragic 33.6% |
| Immigrants | Liberia | 0.9 /100 | #249 | Tragic 33.5% |
| Indonesians | 0.9 /100 | #250 | Tragic 33.5% |
| Japanese | 0.7 /100 | #251 | Tragic 33.3% |
| Immigrants | Bahamas | 0.7 /100 | #252 | Tragic 33.3% |
| U.S. Virgin Islanders | 0.7 /100 | #253 | Tragic 33.2% |
Demographics Similar to Vietnamese by Bachelor's Degree
In terms of bachelor's degree, the demographic groups most similar to Vietnamese are Chinese (38.5%, a difference of 0.0%), Uruguayan (38.4%, a difference of 0.080%), Colombian (38.4%, a difference of 0.16%), Immigrants from Germany (38.6%, a difference of 0.33%), and Peruvian (38.3%, a difference of 0.33%).
| Demographics | Rating | Rank | Bachelor's Degree |
| Slavs | 75.9 /100 | #153 | Good 38.9% |
| Canadians | 75.0 /100 | #154 | Good 38.8% |
| Immigrants | Kenya | 73.8 /100 | #155 | Good 38.8% |
| Kenyans | 72.5 /100 | #156 | Good 38.7% |
| Immigrants | South America | 70.1 /100 | #157 | Good 38.6% |
| Immigrants | Germany | 69.6 /100 | #158 | Good 38.6% |
| Chinese | 66.6 /100 | #159 | Good 38.5% |
| Vietnamese | 66.6 /100 | #160 | Good 38.5% |
| Uruguayans | 65.8 /100 | #161 | Good 38.4% |
| Colombians | 65.0 /100 | #162 | Good 38.4% |
| Peruvians | 63.4 /100 | #163 | Good 38.3% |
| Hungarians | 62.1 /100 | #164 | Good 38.3% |
| Sri Lankans | 59.1 /100 | #165 | Average 38.2% |
| Somalis | 58.6 /100 | #166 | Average 38.1% |
| Scottish | 56.6 /100 | #167 | Average 38.1% |