Jamaican vs Bhutanese Doctorate Degree
COMPARE
Jamaican
Bhutanese
Doctorate Degree
Doctorate Degree Comparison
Jamaicans
Bhutanese
1.5%
DOCTORATE DEGREE
0.3/ 100
METRIC RATING
284th/ 347
METRIC RANK
2.3%
DOCTORATE DEGREE
99.9/ 100
METRIC RATING
61st/ 347
METRIC RANK
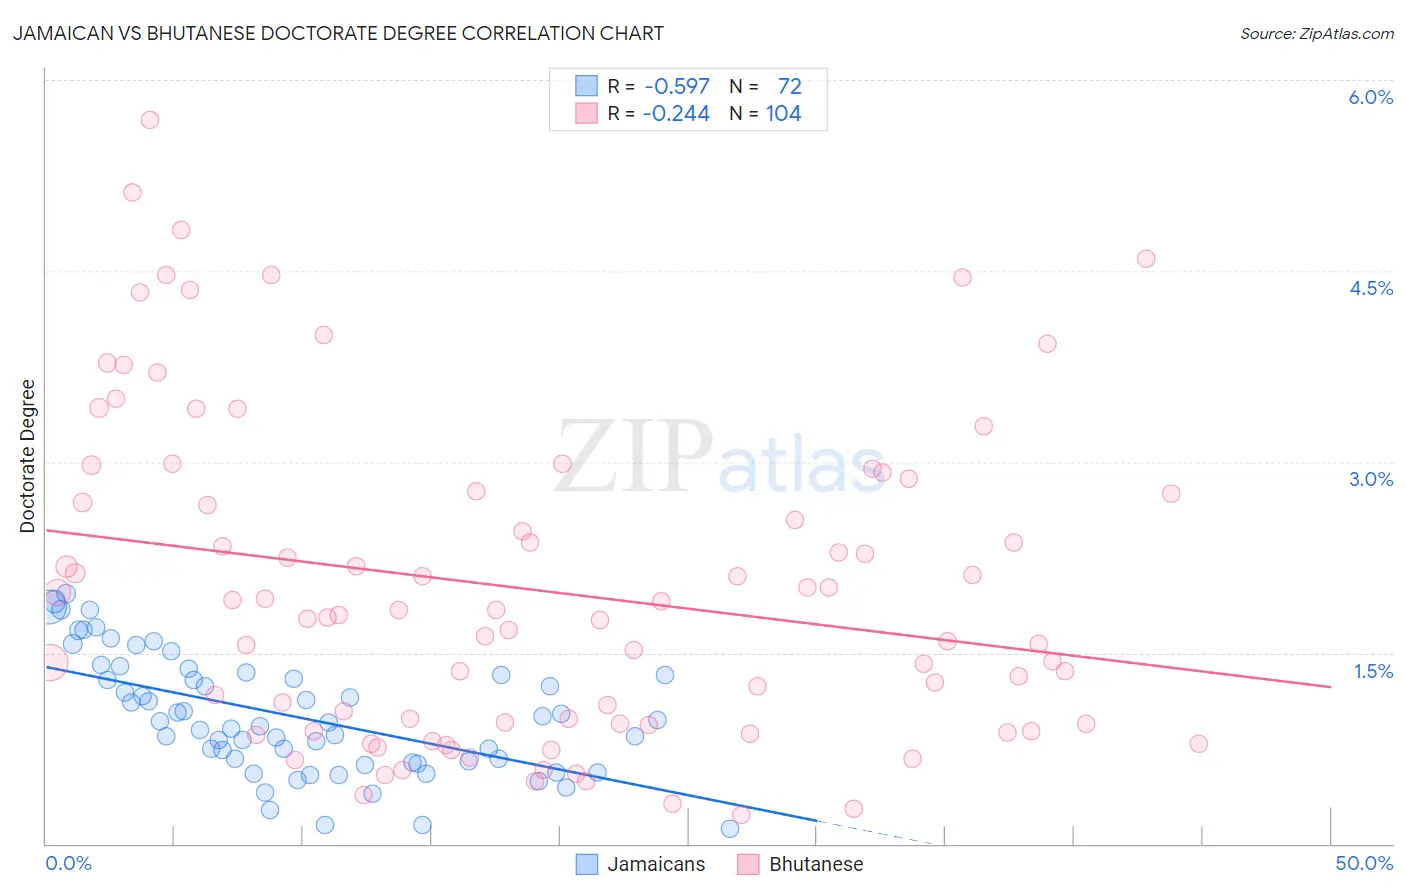
Jamaican vs Bhutanese Doctorate Degree Correlation Chart
The statistical analysis conducted on geographies consisting of 364,326,977 people shows a substantial negative correlation between the proportion of Jamaicans and percentage of population with at least doctorate degree education in the United States with a correlation coefficient (R) of -0.597 and weighted average of 1.5%. Similarly, the statistical analysis conducted on geographies consisting of 449,637,432 people shows a weak negative correlation between the proportion of Bhutanese and percentage of population with at least doctorate degree education in the United States with a correlation coefficient (R) of -0.244 and weighted average of 2.3%, a difference of 59.4%.
Doctorate Degree Correlation Summary
| Measurement | Jamaican | Bhutanese |
| Minimum | 0.12% | 0.23% |
| Maximum | 2.0% | 5.7% |
| Range | 1.8% | 5.5% |
| Mean | 1.0% | 2.0% |
| Median | 0.96% | 1.8% |
| Interquartile 25% (IQ1) | 0.64% | 0.94% |
| Interquartile 75% (IQ3) | 1.3% | 2.8% |
| Interquartile Range (IQR) | 0.69% | 1.8% |
| Standard Deviation (Sample) | 0.46% | 1.3% |
| Standard Deviation (Population) | 0.46% | 1.3% |
Similar Demographics by Doctorate Degree
Demographics Similar to Jamaicans by Doctorate Degree
In terms of doctorate degree, the demographic groups most similar to Jamaicans are Malaysian (1.5%, a difference of 0.030%), Central American (1.5%, a difference of 0.040%), British West Indian (1.5%, a difference of 0.090%), Tohono O'odham (1.5%, a difference of 0.14%), and Ecuadorian (1.5%, a difference of 0.20%).
| Demographics | Rating | Rank | Doctorate Degree |
| Bahamians | 0.4 /100 | #277 | Tragic 1.5% |
| Hawaiians | 0.4 /100 | #278 | Tragic 1.5% |
| Marshallese | 0.4 /100 | #279 | Tragic 1.5% |
| Ecuadorians | 0.4 /100 | #280 | Tragic 1.5% |
| Tohono O'odham | 0.4 /100 | #281 | Tragic 1.5% |
| British West Indians | 0.3 /100 | #282 | Tragic 1.5% |
| Central Americans | 0.3 /100 | #283 | Tragic 1.5% |
| Jamaicans | 0.3 /100 | #284 | Tragic 1.5% |
| Malaysians | 0.3 /100 | #285 | Tragic 1.5% |
| Cherokee | 0.3 /100 | #286 | Tragic 1.5% |
| Cajuns | 0.3 /100 | #287 | Tragic 1.5% |
| Immigrants | El Salvador | 0.3 /100 | #288 | Tragic 1.4% |
| Cape Verdeans | 0.3 /100 | #289 | Tragic 1.4% |
| Choctaw | 0.3 /100 | #290 | Tragic 1.4% |
| Blacks/African Americans | 0.3 /100 | #291 | Tragic 1.4% |
Demographics Similar to Bhutanese by Doctorate Degree
In terms of doctorate degree, the demographic groups most similar to Bhutanese are Immigrants from Europe (2.3%, a difference of 0.52%), Laotian (2.3%, a difference of 0.62%), Immigrants from Serbia (2.3%, a difference of 0.77%), South African (2.3%, a difference of 0.79%), and Immigrants from Greece (2.3%, a difference of 1.0%).
| Demographics | Rating | Rank | Doctorate Degree |
| Immigrants | Indonesia | 100.0 /100 | #54 | Exceptional 2.4% |
| Bolivians | 100.0 /100 | #55 | Exceptional 2.4% |
| Immigrants | Czechoslovakia | 100.0 /100 | #56 | Exceptional 2.4% |
| Immigrants | Ethiopia | 100.0 /100 | #57 | Exceptional 2.4% |
| Ethiopians | 99.9 /100 | #58 | Exceptional 2.3% |
| South Africans | 99.9 /100 | #59 | Exceptional 2.3% |
| Immigrants | Serbia | 99.9 /100 | #60 | Exceptional 2.3% |
| Bhutanese | 99.9 /100 | #61 | Exceptional 2.3% |
| Immigrants | Europe | 99.9 /100 | #62 | Exceptional 2.3% |
| Laotians | 99.9 /100 | #63 | Exceptional 2.3% |
| Immigrants | Greece | 99.9 /100 | #64 | Exceptional 2.3% |
| Paraguayans | 99.9 /100 | #65 | Exceptional 2.3% |
| Argentineans | 99.9 /100 | #66 | Exceptional 2.3% |
| Zimbabweans | 99.8 /100 | #67 | Exceptional 2.3% |
| Immigrants | Kazakhstan | 99.8 /100 | #68 | Exceptional 2.3% |