Spaniard vs British West Indian 3rd Grade
COMPARE
Spaniard
British West Indian
3rd Grade
3rd Grade Comparison
Spaniards
British West Indians
97.9%
3RD GRADE
87.9/ 100
METRIC RATING
136th/ 347
METRIC RANK
97.0%
3RD GRADE
0.0/ 100
METRIC RATING
292nd/ 347
METRIC RANK
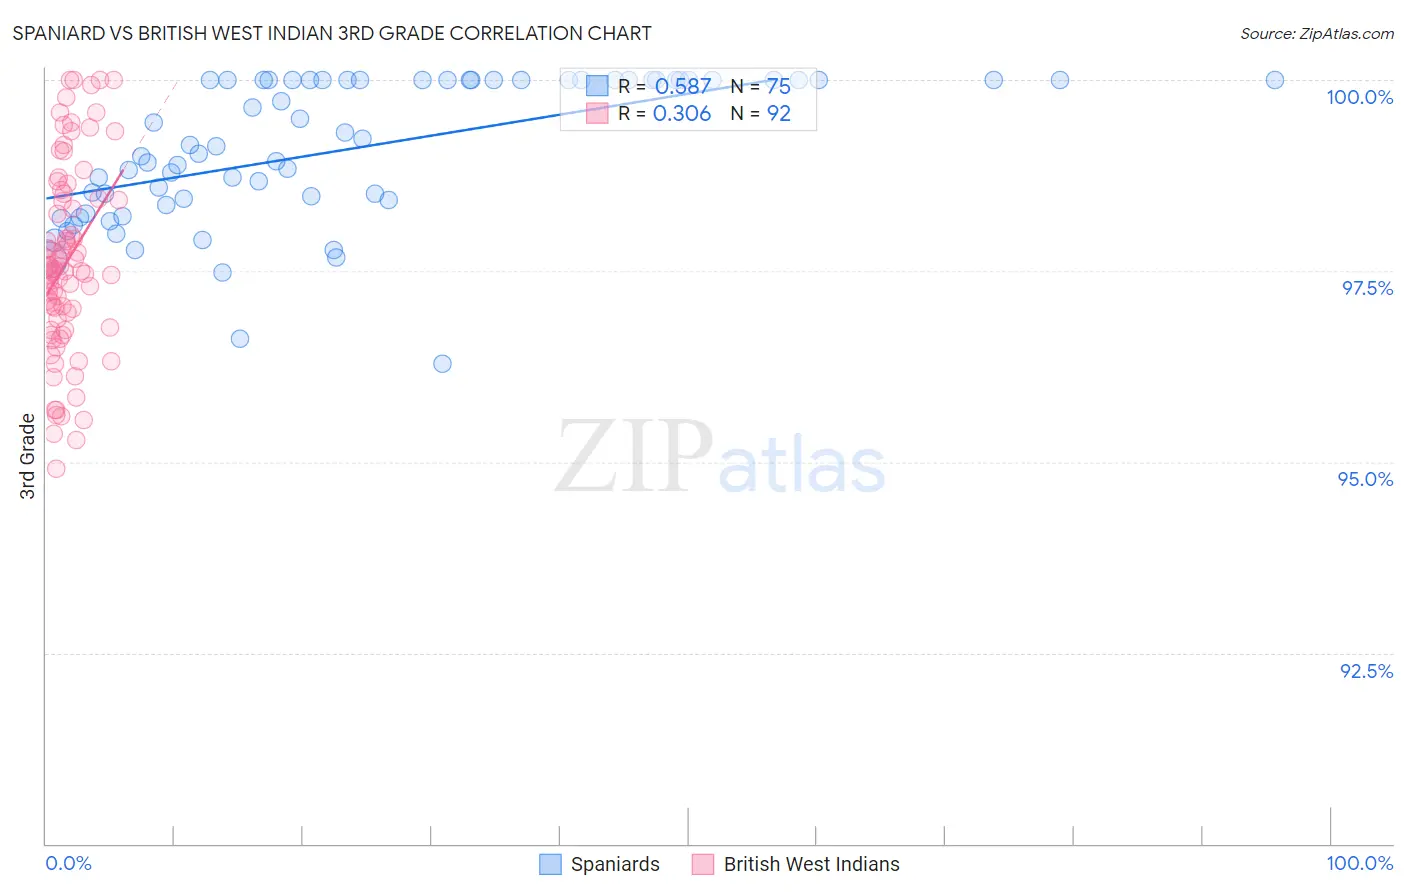
Spaniard vs British West Indian 3rd Grade Correlation Chart
The statistical analysis conducted on geographies consisting of 443,544,503 people shows a substantial positive correlation between the proportion of Spaniards and percentage of population with at least 3rd grade education in the United States with a correlation coefficient (R) of 0.587 and weighted average of 97.9%. Similarly, the statistical analysis conducted on geographies consisting of 152,691,173 people shows a mild positive correlation between the proportion of British West Indians and percentage of population with at least 3rd grade education in the United States with a correlation coefficient (R) of 0.306 and weighted average of 97.0%, a difference of 0.92%.
3rd Grade Correlation Summary
| Measurement | Spaniard | British West Indian |
| Minimum | 96.3% | 94.9% |
| Maximum | 100.0% | 100.0% |
| Range | 3.7% | 5.1% |
| Mean | 99.1% | 97.6% |
| Median | 99.2% | 97.5% |
| Interquartile 25% (IQ1) | 98.4% | 96.8% |
| Interquartile 75% (IQ3) | 100.0% | 98.4% |
| Interquartile Range (IQR) | 1.6% | 1.6% |
| Standard Deviation (Sample) | 0.94% | 1.2% |
| Standard Deviation (Population) | 0.93% | 1.2% |
Similar Demographics by 3rd Grade
Demographics Similar to Spaniards by 3rd Grade
In terms of 3rd grade, the demographic groups most similar to Spaniards are Cambodian (97.9%, a difference of 0.0%), Immigrants from Romania (97.9%, a difference of 0.0%), Immigrants from Bulgaria (97.9%, a difference of 0.010%), Immigrants from Hungary (97.9%, a difference of 0.010%), and Immigrants from Kuwait (97.9%, a difference of 0.010%).
| Demographics | Rating | Rank | 3rd Grade |
| Immigrants | Serbia | 91.9 /100 | #129 | Exceptional 98.0% |
| Immigrants | Europe | 91.2 /100 | #130 | Exceptional 98.0% |
| Immigrants | Bulgaria | 89.1 /100 | #131 | Excellent 97.9% |
| Immigrants | Hungary | 88.8 /100 | #132 | Excellent 97.9% |
| Immigrants | Kuwait | 88.7 /100 | #133 | Excellent 97.9% |
| Seminole | 88.7 /100 | #134 | Excellent 97.9% |
| Cambodians | 88.1 /100 | #135 | Excellent 97.9% |
| Spaniards | 87.9 /100 | #136 | Excellent 97.9% |
| Immigrants | Romania | 87.9 /100 | #137 | Excellent 97.9% |
| Israelis | 86.6 /100 | #138 | Excellent 97.9% |
| Blackfeet | 86.3 /100 | #139 | Excellent 97.9% |
| Palestinians | 84.6 /100 | #140 | Excellent 97.9% |
| Immigrants | Turkey | 83.5 /100 | #141 | Excellent 97.9% |
| Hmong | 80.3 /100 | #142 | Excellent 97.9% |
| Filipinos | 79.9 /100 | #143 | Good 97.9% |
Demographics Similar to British West Indians by 3rd Grade
In terms of 3rd grade, the demographic groups most similar to British West Indians are Immigrants from Portugal (97.0%, a difference of 0.010%), Immigrants from Afghanistan (97.0%, a difference of 0.010%), Immigrants from Grenada (97.0%, a difference of 0.030%), Immigrants from Thailand (97.1%, a difference of 0.040%), and Malaysian (97.0%, a difference of 0.040%).
| Demographics | Rating | Rank | 3rd Grade |
| Immigrants | Hong Kong | 0.0 /100 | #285 | Tragic 97.1% |
| Immigrants | Barbados | 0.0 /100 | #286 | Tragic 97.1% |
| Immigrants | St. Vincent and the Grenadines | 0.0 /100 | #287 | Tragic 97.1% |
| Immigrants | West Indies | 0.0 /100 | #288 | Tragic 97.1% |
| Immigrants | Thailand | 0.0 /100 | #289 | Tragic 97.1% |
| Immigrants | Portugal | 0.0 /100 | #290 | Tragic 97.0% |
| Immigrants | Afghanistan | 0.0 /100 | #291 | Tragic 97.0% |
| British West Indians | 0.0 /100 | #292 | Tragic 97.0% |
| Immigrants | Grenada | 0.0 /100 | #293 | Tragic 97.0% |
| Malaysians | 0.0 /100 | #294 | Tragic 97.0% |
| Immigrants | Eritrea | 0.0 /100 | #295 | Tragic 97.0% |
| Immigrants | Immigrants | 0.0 /100 | #296 | Tragic 96.9% |
| Haitians | 0.0 /100 | #297 | Tragic 96.9% |
| Immigrants | Dominica | 0.0 /100 | #298 | Tragic 96.9% |
| Somalis | 0.0 /100 | #299 | Tragic 96.8% |