Native/Alaskan vs British West Indian 3rd Grade
COMPARE
Native/Alaskan
British West Indian
3rd Grade
3rd Grade Comparison
Natives/Alaskans
British West Indians
97.7%
3RD GRADE
35.2/ 100
METRIC RATING
187th/ 347
METRIC RANK
97.0%
3RD GRADE
0.0/ 100
METRIC RATING
292nd/ 347
METRIC RANK
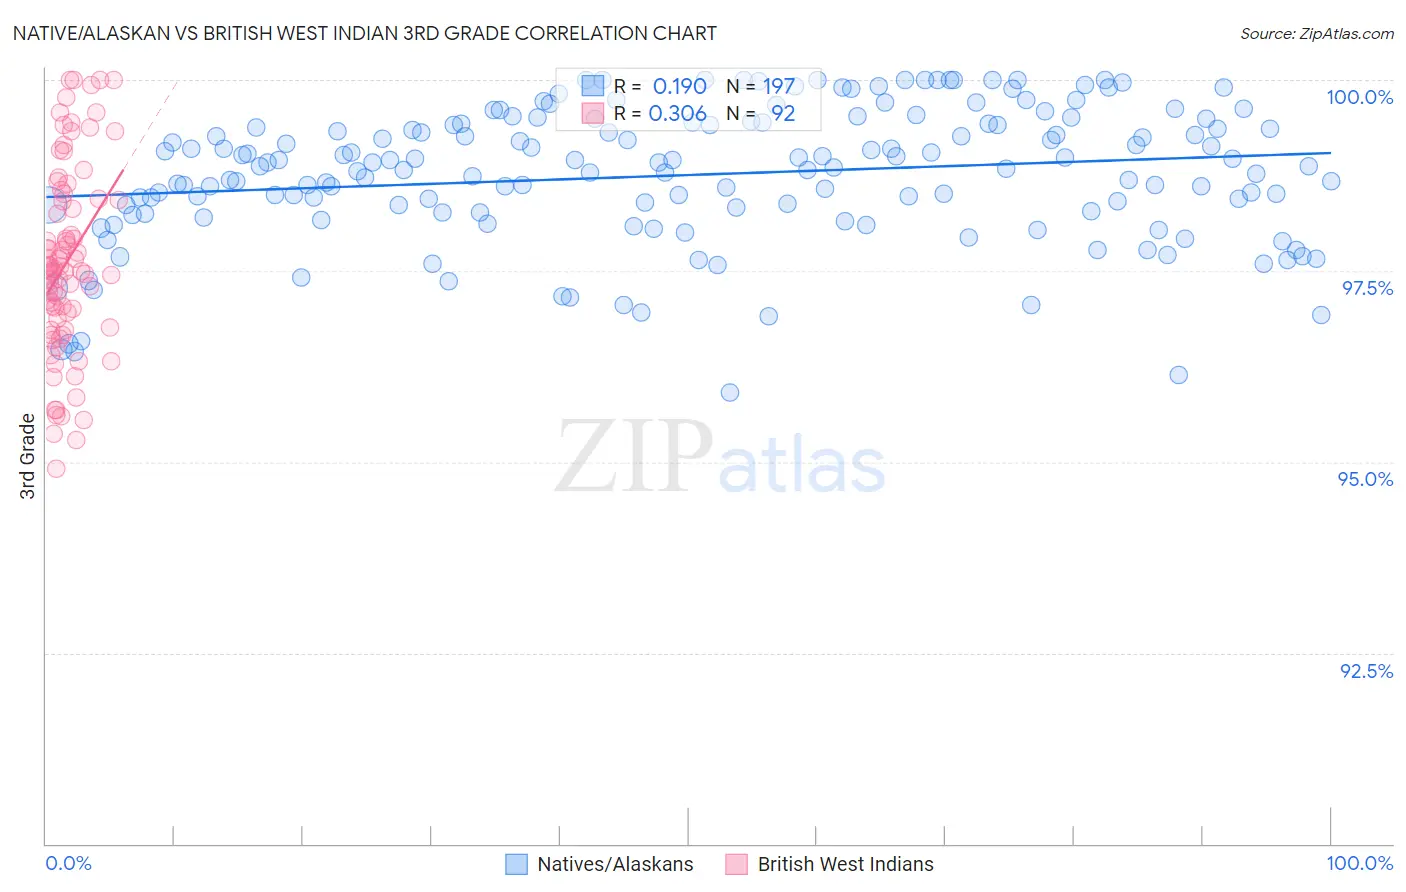
Native/Alaskan vs British West Indian 3rd Grade Correlation Chart
The statistical analysis conducted on geographies consisting of 513,058,987 people shows a poor positive correlation between the proportion of Natives/Alaskans and percentage of population with at least 3rd grade education in the United States with a correlation coefficient (R) of 0.190 and weighted average of 97.7%. Similarly, the statistical analysis conducted on geographies consisting of 152,691,173 people shows a mild positive correlation between the proportion of British West Indians and percentage of population with at least 3rd grade education in the United States with a correlation coefficient (R) of 0.306 and weighted average of 97.0%, a difference of 0.70%.
3rd Grade Correlation Summary
| Measurement | Native/Alaskan | British West Indian |
| Minimum | 95.9% | 94.9% |
| Maximum | 100.0% | 100.0% |
| Range | 4.1% | 5.1% |
| Mean | 98.8% | 97.6% |
| Median | 98.9% | 97.5% |
| Interquartile 25% (IQ1) | 98.3% | 96.8% |
| Interquartile 75% (IQ3) | 99.4% | 98.4% |
| Interquartile Range (IQR) | 1.2% | 1.6% |
| Standard Deviation (Sample) | 0.88% | 1.2% |
| Standard Deviation (Population) | 0.88% | 1.2% |
Similar Demographics by 3rd Grade
Demographics Similar to Natives/Alaskans by 3rd Grade
In terms of 3rd grade, the demographic groups most similar to Natives/Alaskans are Portuguese (97.7%, a difference of 0.0%), Immigrants from Taiwan (97.7%, a difference of 0.0%), Pakistani (97.7%, a difference of 0.0%), Immigrants from Kazakhstan (97.7%, a difference of 0.010%), and Immigrants from Argentina (97.7%, a difference of 0.010%).
| Demographics | Rating | Rank | 3rd Grade |
| Immigrants | Sri Lanka | 45.1 /100 | #180 | Average 97.7% |
| Immigrants | Venezuela | 44.4 /100 | #181 | Average 97.7% |
| Argentineans | 42.9 /100 | #182 | Average 97.7% |
| Arabs | 40.0 /100 | #183 | Fair 97.7% |
| Immigrants | Kazakhstan | 37.4 /100 | #184 | Fair 97.7% |
| Immigrants | Argentina | 37.0 /100 | #185 | Fair 97.7% |
| Portuguese | 36.2 /100 | #186 | Fair 97.7% |
| Natives/Alaskans | 35.2 /100 | #187 | Fair 97.7% |
| Immigrants | Taiwan | 34.2 /100 | #188 | Fair 97.7% |
| Pakistanis | 34.2 /100 | #189 | Fair 97.7% |
| Panamanians | 31.5 /100 | #190 | Fair 97.7% |
| Blacks/African Americans | 29.6 /100 | #191 | Fair 97.7% |
| Mongolians | 29.1 /100 | #192 | Fair 97.7% |
| Immigrants | Kenya | 28.2 /100 | #193 | Fair 97.7% |
| Immigrants | Uganda | 27.4 /100 | #194 | Fair 97.7% |
Demographics Similar to British West Indians by 3rd Grade
In terms of 3rd grade, the demographic groups most similar to British West Indians are Immigrants from Portugal (97.0%, a difference of 0.010%), Immigrants from Afghanistan (97.0%, a difference of 0.010%), Immigrants from Grenada (97.0%, a difference of 0.030%), Immigrants from Thailand (97.1%, a difference of 0.040%), and Malaysian (97.0%, a difference of 0.040%).
| Demographics | Rating | Rank | 3rd Grade |
| Immigrants | Hong Kong | 0.0 /100 | #285 | Tragic 97.1% |
| Immigrants | Barbados | 0.0 /100 | #286 | Tragic 97.1% |
| Immigrants | St. Vincent and the Grenadines | 0.0 /100 | #287 | Tragic 97.1% |
| Immigrants | West Indies | 0.0 /100 | #288 | Tragic 97.1% |
| Immigrants | Thailand | 0.0 /100 | #289 | Tragic 97.1% |
| Immigrants | Portugal | 0.0 /100 | #290 | Tragic 97.0% |
| Immigrants | Afghanistan | 0.0 /100 | #291 | Tragic 97.0% |
| British West Indians | 0.0 /100 | #292 | Tragic 97.0% |
| Immigrants | Grenada | 0.0 /100 | #293 | Tragic 97.0% |
| Malaysians | 0.0 /100 | #294 | Tragic 97.0% |
| Immigrants | Eritrea | 0.0 /100 | #295 | Tragic 97.0% |
| Immigrants | Immigrants | 0.0 /100 | #296 | Tragic 96.9% |
| Haitians | 0.0 /100 | #297 | Tragic 96.9% |
| Immigrants | Dominica | 0.0 /100 | #298 | Tragic 96.9% |
| Somalis | 0.0 /100 | #299 | Tragic 96.8% |