Italian vs Marshallese College, Under 1 year
COMPARE
Italian
Marshallese
College, Under 1 year
College, Under 1 year Comparison
Italians
Marshallese
67.2%
COLLEGE, UNDER 1 YEAR
91.8/ 100
METRIC RATING
125th/ 347
METRIC RANK
61.9%
COLLEGE, UNDER 1 YEAR
0.8/ 100
METRIC RATING
246th/ 347
METRIC RANK
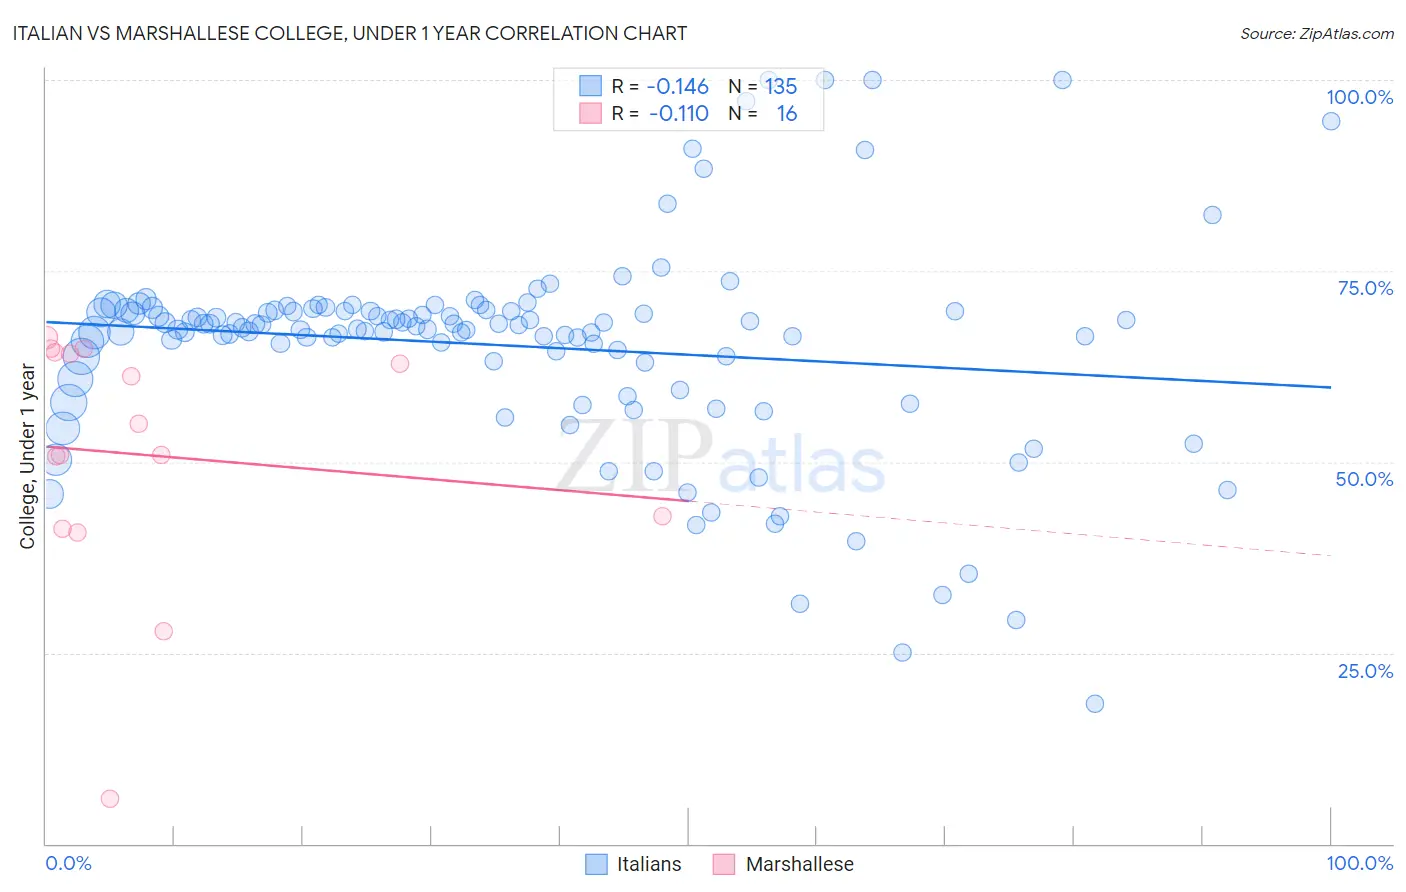
Italian vs Marshallese College, Under 1 year Correlation Chart
The statistical analysis conducted on geographies consisting of 575,108,036 people shows a poor negative correlation between the proportion of Italians and percentage of population with at least college, under 1 year education in the United States with a correlation coefficient (R) of -0.146 and weighted average of 67.2%. Similarly, the statistical analysis conducted on geographies consisting of 14,761,315 people shows a poor negative correlation between the proportion of Marshallese and percentage of population with at least college, under 1 year education in the United States with a correlation coefficient (R) of -0.110 and weighted average of 61.9%, a difference of 8.5%.
College, Under 1 year Correlation Summary
| Measurement | Italian | Marshallese |
| Minimum | 18.4% | 5.9% |
| Maximum | 100.0% | 66.3% |
| Range | 81.6% | 60.4% |
| Mean | 65.2% | 50.9% |
| Median | 67.5% | 52.9% |
| Interquartile 25% (IQ1) | 63.1% | 42.1% |
| Interquartile 75% (IQ3) | 69.8% | 64.2% |
| Interquartile Range (IQR) | 6.7% | 22.1% |
| Standard Deviation (Sample) | 13.7% | 16.5% |
| Standard Deviation (Population) | 13.6% | 15.9% |
Similar Demographics by College, Under 1 year
Demographics Similar to Italians by College, Under 1 year
In terms of college, under 1 year, the demographic groups most similar to Italians are Alsatian (67.1%, a difference of 0.060%), Arab (67.2%, a difference of 0.12%), Immigrants from Northern Africa (67.2%, a difference of 0.13%), Czech (67.1%, a difference of 0.14%), and Immigrants from Jordan (67.3%, a difference of 0.15%).
| Demographics | Rating | Rank | College, Under 1 year |
| Immigrants | Ukraine | 94.7 /100 | #118 | Exceptional 67.5% |
| Lebanese | 94.6 /100 | #119 | Exceptional 67.5% |
| Serbians | 93.9 /100 | #120 | Exceptional 67.4% |
| Slovenes | 93.3 /100 | #121 | Exceptional 67.3% |
| Immigrants | Jordan | 92.8 /100 | #122 | Exceptional 67.3% |
| Immigrants | Northern Africa | 92.7 /100 | #123 | Exceptional 67.2% |
| Arabs | 92.6 /100 | #124 | Exceptional 67.2% |
| Italians | 91.8 /100 | #125 | Exceptional 67.2% |
| Alsatians | 91.3 /100 | #126 | Exceptional 67.1% |
| Czechs | 90.8 /100 | #127 | Exceptional 67.1% |
| Scottish | 90.2 /100 | #128 | Exceptional 67.0% |
| Immigrants | Eastern Africa | 89.5 /100 | #129 | Excellent 67.0% |
| Immigrants | Syria | 89.0 /100 | #130 | Excellent 66.9% |
| Finns | 88.6 /100 | #131 | Excellent 66.9% |
| Poles | 88.4 /100 | #132 | Excellent 66.9% |
Demographics Similar to Marshallese by College, Under 1 year
In terms of college, under 1 year, the demographic groups most similar to Marshallese are Immigrants from Liberia (61.9%, a difference of 0.020%), Delaware (62.1%, a difference of 0.22%), Potawatomi (61.8%, a difference of 0.26%), Colville (62.1%, a difference of 0.28%), and Hawaiian (62.1%, a difference of 0.37%).
| Demographics | Rating | Rank | College, Under 1 year |
| Nepalese | 1.1 /100 | #239 | Tragic 62.2% |
| Aleuts | 1.1 /100 | #240 | Tragic 62.2% |
| Ottawa | 1.1 /100 | #241 | Tragic 62.2% |
| Malaysians | 1.1 /100 | #242 | Tragic 62.2% |
| Hawaiians | 1.1 /100 | #243 | Tragic 62.1% |
| Colville | 1.0 /100 | #244 | Tragic 62.1% |
| Delaware | 0.9 /100 | #245 | Tragic 62.1% |
| Marshallese | 0.8 /100 | #246 | Tragic 61.9% |
| Immigrants | Liberia | 0.8 /100 | #247 | Tragic 61.9% |
| Potawatomi | 0.6 /100 | #248 | Tragic 61.8% |
| Vietnamese | 0.5 /100 | #249 | Tragic 61.7% |
| Immigrants | Congo | 0.5 /100 | #250 | Tragic 61.7% |
| Immigrants | Micronesia | 0.5 /100 | #251 | Tragic 61.5% |
| West Indians | 0.4 /100 | #252 | Tragic 61.5% |
| Japanese | 0.4 /100 | #253 | Tragic 61.5% |