Israeli vs Immigrants from Ukraine 10th Grade
COMPARE
Israeli
Immigrants from Ukraine
10th Grade
10th Grade Comparison
Israelis
Immigrants from Ukraine
94.3%
10TH GRADE
93.8/ 100
METRIC RATING
127th/ 347
METRIC RANK
94.0%
10TH GRADE
81.5/ 100
METRIC RATING
147th/ 347
METRIC RANK
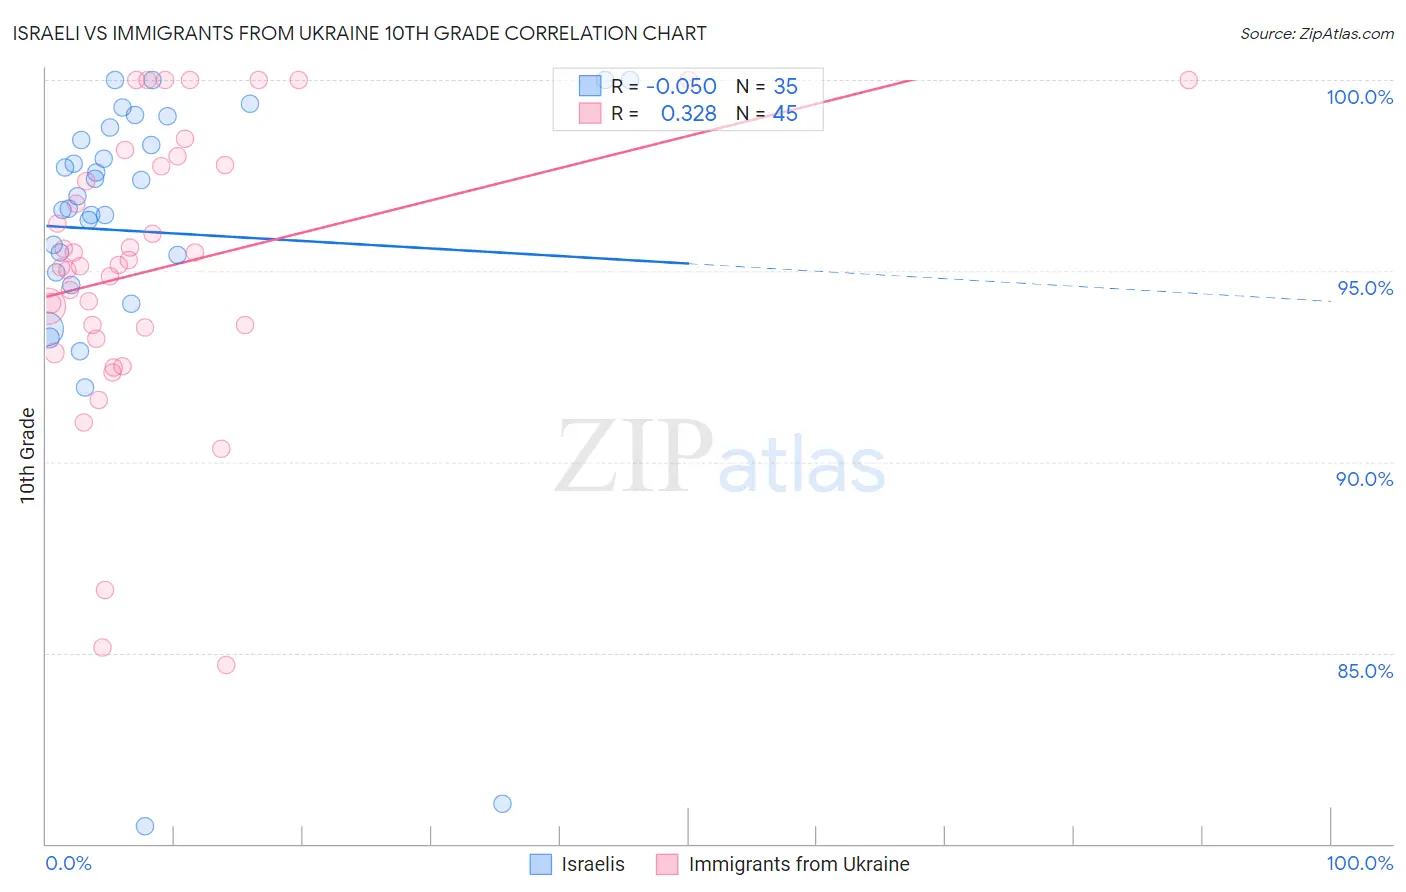
Israeli vs Immigrants from Ukraine 10th Grade Correlation Chart
The statistical analysis conducted on geographies consisting of 211,220,151 people shows no correlation between the proportion of Israelis and percentage of population with at least 10th grade education in the United States with a correlation coefficient (R) of -0.050 and weighted average of 94.3%. Similarly, the statistical analysis conducted on geographies consisting of 289,714,613 people shows a mild positive correlation between the proportion of Immigrants from Ukraine and percentage of population with at least 10th grade education in the United States with a correlation coefficient (R) of 0.328 and weighted average of 94.0%, a difference of 0.28%.
10th Grade Correlation Summary
| Measurement | Israeli | Immigrants from Ukraine |
| Minimum | 80.4% | 84.7% |
| Maximum | 100.0% | 100.0% |
| Range | 19.6% | 15.3% |
| Mean | 96.0% | 95.1% |
| Median | 97.0% | 95.2% |
| Interquartile 25% (IQ1) | 95.0% | 93.4% |
| Interquartile 75% (IQ3) | 98.8% | 97.9% |
| Interquartile Range (IQR) | 3.8% | 4.5% |
| Standard Deviation (Sample) | 4.4% | 3.7% |
| Standard Deviation (Population) | 4.3% | 3.7% |
Demographics Similar to Israelis and Immigrants from Ukraine by 10th Grade
In terms of 10th grade, the demographic groups most similar to Israelis are Potawatomi (94.3%, a difference of 0.010%), Iroquois (94.3%, a difference of 0.040%), Immigrants from Greece (94.3%, a difference of 0.040%), Immigrants from Eastern Europe (94.3%, a difference of 0.050%), and Immigrants from Russia (94.3%, a difference of 0.050%). Similarly, the demographic groups most similar to Immigrants from Ukraine are Chickasaw (94.1%, a difference of 0.020%), Nonimmigrants (94.1%, a difference of 0.040%), Cherokee (94.1%, a difference of 0.050%), Immigrants from Kazakhstan (94.1%, a difference of 0.050%), and Hmong (94.1%, a difference of 0.080%).
| Demographics | Rating | Rank | 10th Grade |
| Israelis | 93.8 /100 | #127 | Exceptional 94.3% |
| Potawatomi | 93.6 /100 | #128 | Exceptional 94.3% |
| Iroquois | 92.8 /100 | #129 | Exceptional 94.3% |
| Immigrants | Greece | 92.7 /100 | #130 | Exceptional 94.3% |
| Immigrants | Eastern Europe | 92.5 /100 | #131 | Exceptional 94.3% |
| Immigrants | Russia | 92.4 /100 | #132 | Exceptional 94.3% |
| Creek | 91.9 /100 | #133 | Exceptional 94.2% |
| Osage | 91.7 /100 | #134 | Exceptional 94.2% |
| Immigrants | Korea | 91.3 /100 | #135 | Exceptional 94.2% |
| Shoshone | 90.8 /100 | #136 | Exceptional 94.2% |
| Arapaho | 90.5 /100 | #137 | Exceptional 94.2% |
| Immigrants | Sri Lanka | 89.9 /100 | #138 | Excellent 94.2% |
| Immigrants | Bosnia and Herzegovina | 89.4 /100 | #139 | Excellent 94.2% |
| Immigrants | Jordan | 87.6 /100 | #140 | Excellent 94.1% |
| Hmong | 86.6 /100 | #141 | Excellent 94.1% |
| Albanians | 86.5 /100 | #142 | Excellent 94.1% |
| Cherokee | 84.9 /100 | #143 | Excellent 94.1% |
| Immigrants | Kazakhstan | 84.9 /100 | #144 | Excellent 94.1% |
| Immigrants | Nonimmigrants | 83.8 /100 | #145 | Excellent 94.1% |
| Chickasaw | 82.6 /100 | #146 | Excellent 94.1% |
| Immigrants | Ukraine | 81.5 /100 | #147 | Excellent 94.0% |