Israeli vs Immigrants from Ukraine 7th Grade
COMPARE
Israeli
Immigrants from Ukraine
7th Grade
7th Grade Comparison
Israelis
Immigrants from Ukraine
96.3%
7TH GRADE
82.8/ 100
METRIC RATING
148th/ 347
METRIC RANK
96.1%
7TH GRADE
55.0/ 100
METRIC RATING
170th/ 347
METRIC RANK
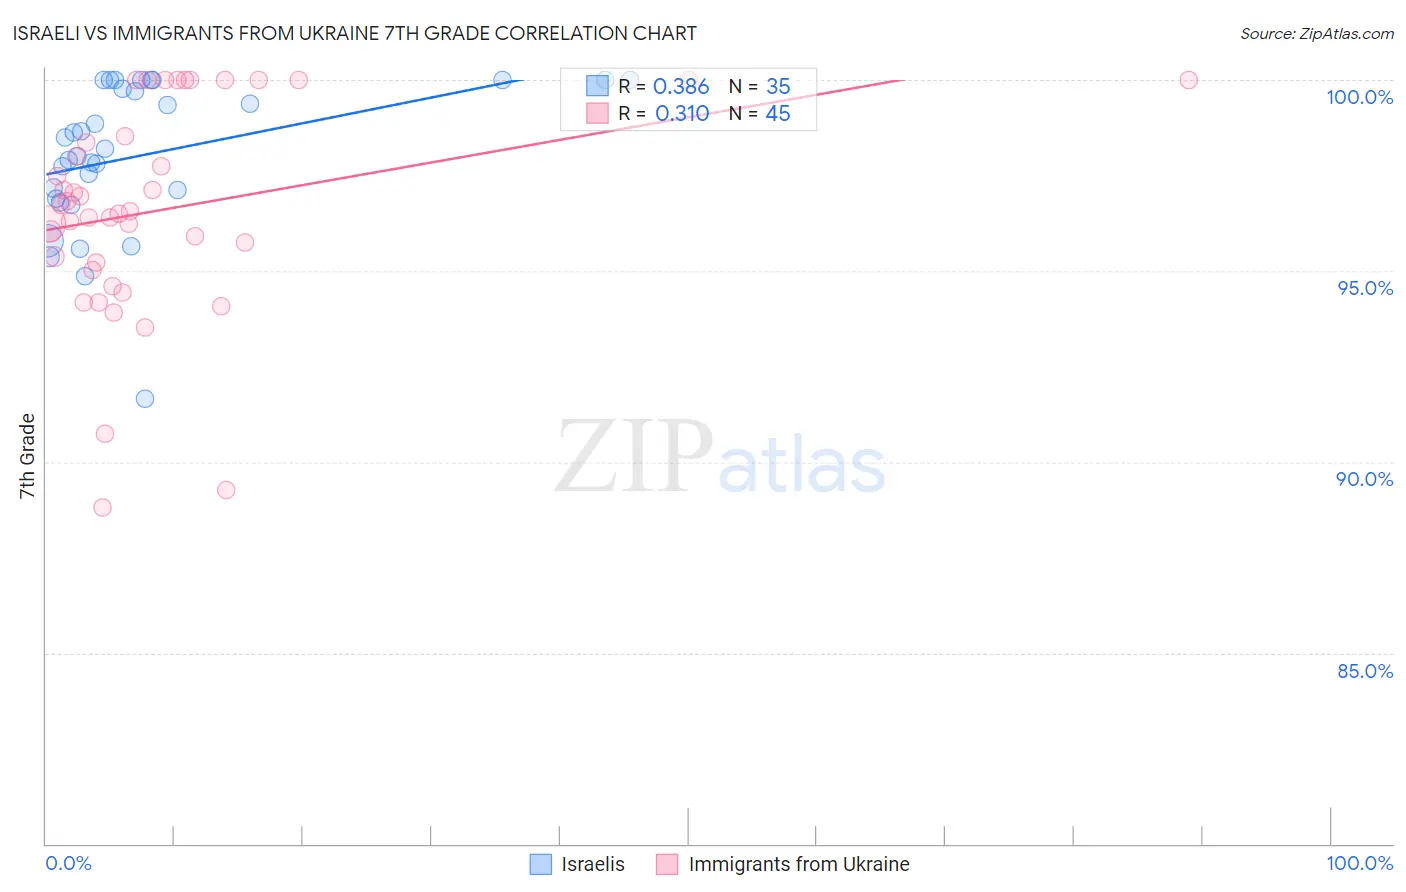
Israeli vs Immigrants from Ukraine 7th Grade Correlation Chart
The statistical analysis conducted on geographies consisting of 211,220,151 people shows a mild positive correlation between the proportion of Israelis and percentage of population with at least 7th grade education in the United States with a correlation coefficient (R) of 0.386 and weighted average of 96.3%. Similarly, the statistical analysis conducted on geographies consisting of 289,714,613 people shows a mild positive correlation between the proportion of Immigrants from Ukraine and percentage of population with at least 7th grade education in the United States with a correlation coefficient (R) of 0.310 and weighted average of 96.1%, a difference of 0.21%.
7th Grade Correlation Summary
| Measurement | Israeli | Immigrants from Ukraine |
| Minimum | 91.7% | 88.8% |
| Maximum | 100.0% | 100.0% |
| Range | 8.3% | 11.2% |
| Mean | 98.0% | 96.6% |
| Median | 98.2% | 96.6% |
| Interquartile 25% (IQ1) | 96.9% | 95.1% |
| Interquartile 75% (IQ3) | 100.0% | 99.3% |
| Interquartile Range (IQR) | 3.1% | 4.1% |
| Standard Deviation (Sample) | 1.9% | 2.8% |
| Standard Deviation (Population) | 1.9% | 2.7% |
Similar Demographics by 7th Grade
Demographics Similar to Israelis by 7th Grade
In terms of 7th grade, the demographic groups most similar to Israelis are French American Indian (96.3%, a difference of 0.0%), Albanian (96.3%, a difference of 0.0%), Immigrants from Belarus (96.3%, a difference of 0.0%), Blackfeet (96.3%, a difference of 0.010%), and Immigrants from Eastern Europe (96.3%, a difference of 0.010%).
| Demographics | Rating | Rank | 7th Grade |
| Immigrants | South Central Asia | 87.1 /100 | #141 | Excellent 96.3% |
| Burmese | 87.1 /100 | #142 | Excellent 96.3% |
| Spanish | 86.6 /100 | #143 | Excellent 96.3% |
| Immigrants | Greece | 85.9 /100 | #144 | Excellent 96.3% |
| Blackfeet | 83.9 /100 | #145 | Excellent 96.3% |
| Immigrants | Eastern Europe | 83.7 /100 | #146 | Excellent 96.3% |
| French American Indians | 83.1 /100 | #147 | Excellent 96.3% |
| Israelis | 82.8 /100 | #148 | Excellent 96.3% |
| Albanians | 82.6 /100 | #149 | Excellent 96.3% |
| Immigrants | Belarus | 82.4 /100 | #150 | Excellent 96.3% |
| Hopi | 81.6 /100 | #151 | Excellent 96.3% |
| Immigrants | Russia | 78.4 /100 | #152 | Good 96.2% |
| Seminole | 78.1 /100 | #153 | Good 96.2% |
| Immigrants | Israel | 77.6 /100 | #154 | Good 96.2% |
| Immigrants | Jordan | 77.0 /100 | #155 | Good 96.2% |
Demographics Similar to Immigrants from Ukraine by 7th Grade
In terms of 7th grade, the demographic groups most similar to Immigrants from Ukraine are Ute (96.1%, a difference of 0.0%), Egyptian (96.1%, a difference of 0.0%), Immigrants from Poland (96.1%, a difference of 0.020%), Venezuelan (96.0%, a difference of 0.020%), and Immigrants from Sri Lanka (96.1%, a difference of 0.030%).
| Demographics | Rating | Rank | 7th Grade |
| Spaniards | 62.6 /100 | #163 | Good 96.1% |
| Immigrants | Italy | 62.1 /100 | #164 | Good 96.1% |
| Immigrants | Taiwan | 61.5 /100 | #165 | Good 96.1% |
| Immigrants | Kazakhstan | 61.0 /100 | #166 | Good 96.1% |
| Immigrants | Sri Lanka | 59.9 /100 | #167 | Average 96.1% |
| Immigrants | Poland | 59.0 /100 | #168 | Average 96.1% |
| Ute | 55.8 /100 | #169 | Average 96.1% |
| Immigrants | Ukraine | 55.0 /100 | #170 | Average 96.1% |
| Egyptians | 54.2 /100 | #171 | Average 96.1% |
| Venezuelans | 51.4 /100 | #172 | Average 96.0% |
| Immigrants | Albania | 50.4 /100 | #173 | Average 96.0% |
| Mongolians | 50.0 /100 | #174 | Average 96.0% |
| Blacks/African Americans | 49.5 /100 | #175 | Average 96.0% |
| Chileans | 49.3 /100 | #176 | Average 96.0% |
| Immigrants | Korea | 49.2 /100 | #177 | Average 96.0% |