Israeli vs Immigrants from Hong Kong 7th Grade
COMPARE
Israeli
Immigrants from Hong Kong
7th Grade
7th Grade Comparison
Israelis
Immigrants from Hong Kong
96.3%
7TH GRADE
82.8/ 100
METRIC RATING
148th/ 347
METRIC RANK
95.2%
7TH GRADE
0.3/ 100
METRIC RATING
268th/ 347
METRIC RANK
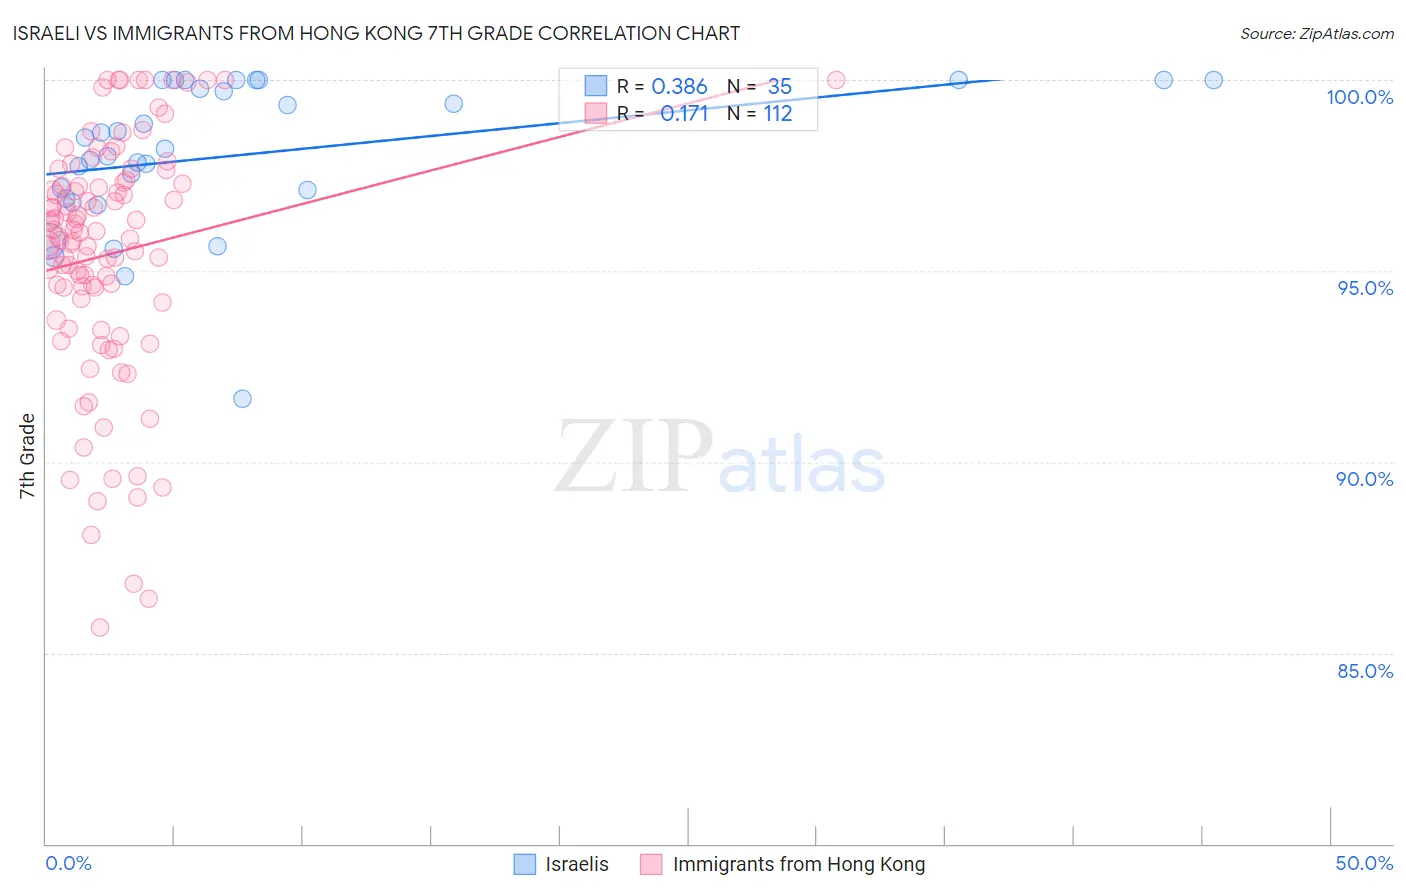
Israeli vs Immigrants from Hong Kong 7th Grade Correlation Chart
The statistical analysis conducted on geographies consisting of 211,220,151 people shows a mild positive correlation between the proportion of Israelis and percentage of population with at least 7th grade education in the United States with a correlation coefficient (R) of 0.386 and weighted average of 96.3%. Similarly, the statistical analysis conducted on geographies consisting of 253,949,931 people shows a poor positive correlation between the proportion of Immigrants from Hong Kong and percentage of population with at least 7th grade education in the United States with a correlation coefficient (R) of 0.171 and weighted average of 95.2%, a difference of 1.1%.
7th Grade Correlation Summary
| Measurement | Israeli | Immigrants from Hong Kong |
| Minimum | 91.7% | 85.7% |
| Maximum | 100.0% | 100.0% |
| Range | 8.3% | 14.3% |
| Mean | 98.0% | 95.4% |
| Median | 98.2% | 95.9% |
| Interquartile 25% (IQ1) | 96.9% | 94.2% |
| Interquartile 75% (IQ3) | 100.0% | 97.3% |
| Interquartile Range (IQR) | 3.1% | 3.1% |
| Standard Deviation (Sample) | 1.9% | 3.2% |
| Standard Deviation (Population) | 1.9% | 3.1% |
Similar Demographics by 7th Grade
Demographics Similar to Israelis by 7th Grade
In terms of 7th grade, the demographic groups most similar to Israelis are French American Indian (96.3%, a difference of 0.0%), Albanian (96.3%, a difference of 0.0%), Immigrants from Belarus (96.3%, a difference of 0.0%), Blackfeet (96.3%, a difference of 0.010%), and Immigrants from Eastern Europe (96.3%, a difference of 0.010%).
| Demographics | Rating | Rank | 7th Grade |
| Immigrants | South Central Asia | 87.1 /100 | #141 | Excellent 96.3% |
| Burmese | 87.1 /100 | #142 | Excellent 96.3% |
| Spanish | 86.6 /100 | #143 | Excellent 96.3% |
| Immigrants | Greece | 85.9 /100 | #144 | Excellent 96.3% |
| Blackfeet | 83.9 /100 | #145 | Excellent 96.3% |
| Immigrants | Eastern Europe | 83.7 /100 | #146 | Excellent 96.3% |
| French American Indians | 83.1 /100 | #147 | Excellent 96.3% |
| Israelis | 82.8 /100 | #148 | Excellent 96.3% |
| Albanians | 82.6 /100 | #149 | Excellent 96.3% |
| Immigrants | Belarus | 82.4 /100 | #150 | Excellent 96.3% |
| Hopi | 81.6 /100 | #151 | Excellent 96.3% |
| Immigrants | Russia | 78.4 /100 | #152 | Good 96.2% |
| Seminole | 78.1 /100 | #153 | Good 96.2% |
| Immigrants | Israel | 77.6 /100 | #154 | Good 96.2% |
| Immigrants | Jordan | 77.0 /100 | #155 | Good 96.2% |
Demographics Similar to Immigrants from Hong Kong by 7th Grade
In terms of 7th grade, the demographic groups most similar to Immigrants from Hong Kong are Yuman (95.2%, a difference of 0.010%), Immigrants from Uruguay (95.2%, a difference of 0.020%), Immigrants from Ghana (95.2%, a difference of 0.020%), Trinidadian and Tobagonian (95.2%, a difference of 0.020%), and Houma (95.1%, a difference of 0.040%).
| Demographics | Rating | Rank | 7th Grade |
| South Americans | 0.5 /100 | #261 | Tragic 95.2% |
| Immigrants | Somalia | 0.5 /100 | #262 | Tragic 95.2% |
| West Indians | 0.5 /100 | #263 | Tragic 95.2% |
| Immigrants | Nigeria | 0.4 /100 | #264 | Tragic 95.2% |
| Immigrants | Uruguay | 0.3 /100 | #265 | Tragic 95.2% |
| Immigrants | Ghana | 0.3 /100 | #266 | Tragic 95.2% |
| Yuman | 0.3 /100 | #267 | Tragic 95.2% |
| Immigrants | Hong Kong | 0.3 /100 | #268 | Tragic 95.2% |
| Trinidadians and Tobagonians | 0.3 /100 | #269 | Tragic 95.2% |
| Houma | 0.2 /100 | #270 | Tragic 95.1% |
| Immigrants | South America | 0.2 /100 | #271 | Tragic 95.1% |
| Peruvians | 0.2 /100 | #272 | Tragic 95.1% |
| Immigrants | Uzbekistan | 0.2 /100 | #273 | Tragic 95.1% |
| Immigrants | Western Africa | 0.2 /100 | #274 | Tragic 95.1% |
| Immigrants | Colombia | 0.2 /100 | #275 | Tragic 95.1% |