Dominican vs Immigrants from Hong Kong 7th Grade
COMPARE
Dominican
Immigrants from Hong Kong
7th Grade
7th Grade Comparison
Dominicans
Immigrants from Hong Kong
93.3%
7TH GRADE
0.0/ 100
METRIC RATING
324th/ 347
METRIC RANK
95.2%
7TH GRADE
0.3/ 100
METRIC RATING
268th/ 347
METRIC RANK
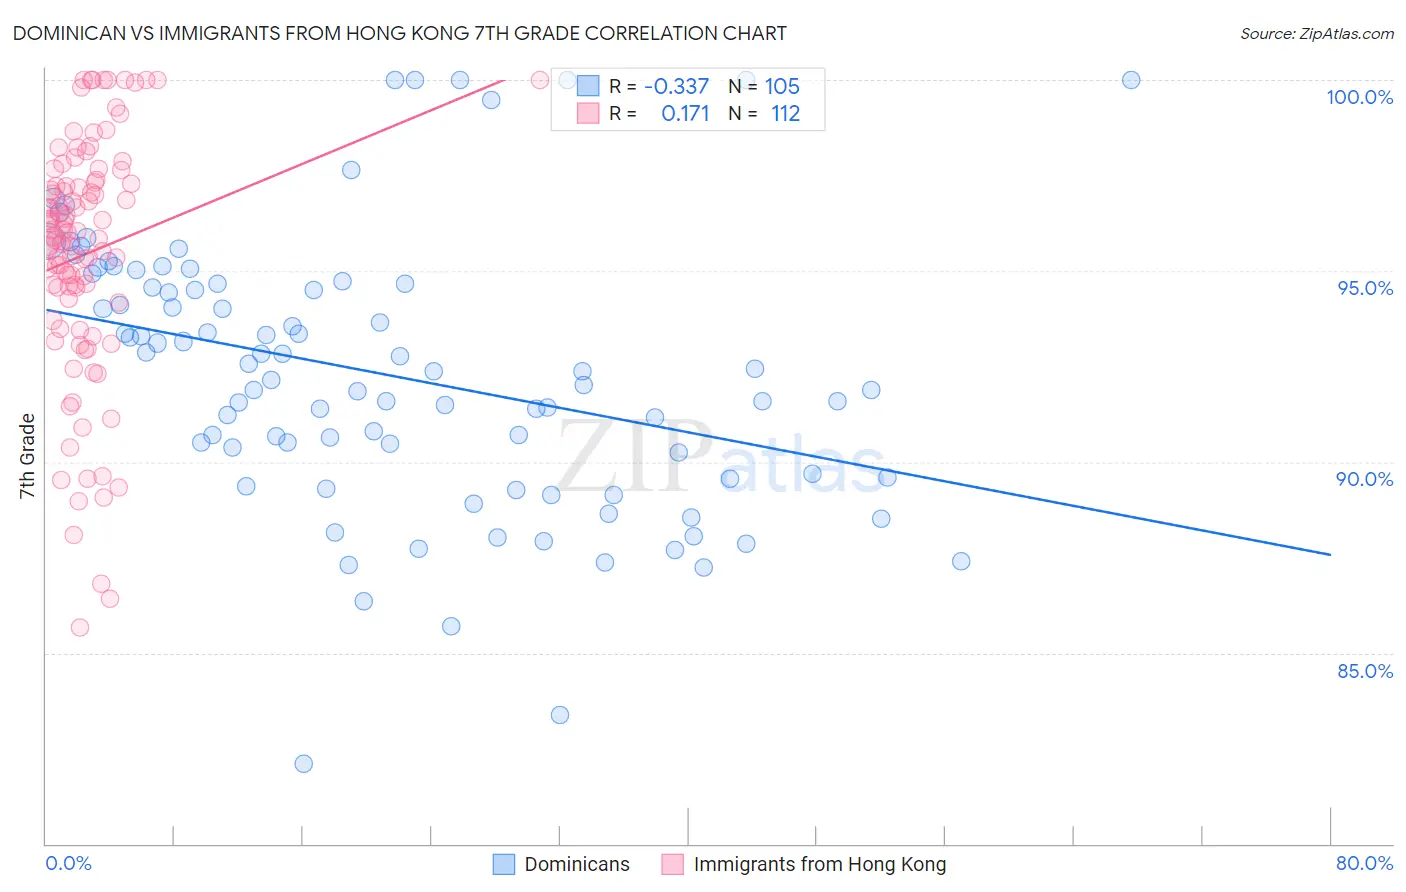
Dominican vs Immigrants from Hong Kong 7th Grade Correlation Chart
The statistical analysis conducted on geographies consisting of 355,142,603 people shows a mild negative correlation between the proportion of Dominicans and percentage of population with at least 7th grade education in the United States with a correlation coefficient (R) of -0.337 and weighted average of 93.3%. Similarly, the statistical analysis conducted on geographies consisting of 253,949,931 people shows a poor positive correlation between the proportion of Immigrants from Hong Kong and percentage of population with at least 7th grade education in the United States with a correlation coefficient (R) of 0.171 and weighted average of 95.2%, a difference of 2.0%.
7th Grade Correlation Summary
| Measurement | Dominican | Immigrants from Hong Kong |
| Minimum | 82.1% | 85.7% |
| Maximum | 100.0% | 100.0% |
| Range | 17.9% | 14.3% |
| Mean | 92.3% | 95.4% |
| Median | 92.4% | 95.9% |
| Interquartile 25% (IQ1) | 89.6% | 94.2% |
| Interquartile 75% (IQ3) | 94.7% | 97.3% |
| Interquartile Range (IQR) | 5.0% | 3.1% |
| Standard Deviation (Sample) | 3.6% | 3.2% |
| Standard Deviation (Population) | 3.6% | 3.1% |
Similar Demographics by 7th Grade
Demographics Similar to Dominicans by 7th Grade
In terms of 7th grade, the demographic groups most similar to Dominicans are Immigrants from Belize (93.4%, a difference of 0.020%), Central American Indian (93.3%, a difference of 0.070%), Nicaraguan (93.5%, a difference of 0.13%), Belizean (93.5%, a difference of 0.16%), and Nepalese (93.2%, a difference of 0.18%).
| Demographics | Rating | Rank | 7th Grade |
| Immigrants | Cuba | 0.0 /100 | #317 | Tragic 93.8% |
| Immigrants | Ecuador | 0.0 /100 | #318 | Tragic 93.7% |
| Immigrants | Cambodia | 0.0 /100 | #319 | Tragic 93.7% |
| Immigrants | Fiji | 0.0 /100 | #320 | Tragic 93.5% |
| Belizeans | 0.0 /100 | #321 | Tragic 93.5% |
| Nicaraguans | 0.0 /100 | #322 | Tragic 93.5% |
| Immigrants | Belize | 0.0 /100 | #323 | Tragic 93.4% |
| Dominicans | 0.0 /100 | #324 | Tragic 93.3% |
| Central American Indians | 0.0 /100 | #325 | Tragic 93.3% |
| Nepalese | 0.0 /100 | #326 | Tragic 93.2% |
| Immigrants | Cabo Verde | 0.0 /100 | #327 | Tragic 93.1% |
| Immigrants | Nicaragua | 0.0 /100 | #328 | Tragic 93.0% |
| Immigrants | Azores | 0.0 /100 | #329 | Tragic 93.0% |
| Immigrants | Dominican Republic | 0.0 /100 | #330 | Tragic 92.9% |
| Hondurans | 0.0 /100 | #331 | Tragic 92.9% |
Demographics Similar to Immigrants from Hong Kong by 7th Grade
In terms of 7th grade, the demographic groups most similar to Immigrants from Hong Kong are Yuman (95.2%, a difference of 0.010%), Immigrants from Uruguay (95.2%, a difference of 0.020%), Immigrants from Ghana (95.2%, a difference of 0.020%), Trinidadian and Tobagonian (95.2%, a difference of 0.020%), and Houma (95.1%, a difference of 0.040%).
| Demographics | Rating | Rank | 7th Grade |
| South Americans | 0.5 /100 | #261 | Tragic 95.2% |
| Immigrants | Somalia | 0.5 /100 | #262 | Tragic 95.2% |
| West Indians | 0.5 /100 | #263 | Tragic 95.2% |
| Immigrants | Nigeria | 0.4 /100 | #264 | Tragic 95.2% |
| Immigrants | Uruguay | 0.3 /100 | #265 | Tragic 95.2% |
| Immigrants | Ghana | 0.3 /100 | #266 | Tragic 95.2% |
| Yuman | 0.3 /100 | #267 | Tragic 95.2% |
| Immigrants | Hong Kong | 0.3 /100 | #268 | Tragic 95.2% |
| Trinidadians and Tobagonians | 0.3 /100 | #269 | Tragic 95.2% |
| Houma | 0.2 /100 | #270 | Tragic 95.1% |
| Immigrants | South America | 0.2 /100 | #271 | Tragic 95.1% |
| Peruvians | 0.2 /100 | #272 | Tragic 95.1% |
| Immigrants | Uzbekistan | 0.2 /100 | #273 | Tragic 95.1% |
| Immigrants | Western Africa | 0.2 /100 | #274 | Tragic 95.1% |
| Immigrants | Colombia | 0.2 /100 | #275 | Tragic 95.1% |