Israeli vs Immigrants from England 7th Grade

COMPARE

Israeli
Race
Ancestry
AfghanAfricanAlaska NativeAlaskan AthabascanAlbanianAleutAlsatianAmericanApacheArabArapahoArgentineanArmenianAssyrian/Chaldean/SyriacAustralianAustrianBahamianBangladeshiBarbadianBasqueBelgianBelizeanBermudanBhutaneseBlackfeetBolivianBrazilianBritishBritish West IndianBulgarianBurmeseCajunCambodianCanadianCape VerdeanCarpatho RusynCelticCentral AmericanCentral American IndianCherokeeCheyenneChickasawChileanChineseChippewaChoctawColombianColvilleComancheCosta RicanCreeCreekCroatianCrowCubanCypriotCzechCzechoslovakianDanishDelawareDominicanDutchDutch West IndianEastern EuropeanEcuadorianEgyptianEnglishEstonianEthiopianEuropeanFijianFilipinoFinnishFrenchFrench American IndianFrench CanadianGermanGerman RussianGhanaianGreekGuamanian/ChamorroGuatemalanGuyaneseHaitianHmongHonduranHopiHoumaHungarianIcelanderIndian (Asian)IndonesianInupiatIranianIraqiIrishIroquoisIsraeliItalianJamaicanJapaneseJordanianKenyanKiowaKoreanLaotianLatvianLebaneseLiberianLithuanianLumbeeLuxembourgerMacedonianMalaysianMalteseMarshalleseMenomineeMexicanMexican American IndianMongolianMoroccanNative HawaiianNavajoNepaleseNew ZealanderNicaraguanNigerianNorthern EuropeanNorwegianOkinawanOsageOttawaPaiutePakistaniPalestinianPanamanianParaguayanPennsylvania GermanPeruvianPimaPolishPortuguesePotawatomiPuebloPuerto RicanPuget Sound SalishRomanianRussianSalvadoranSamoanScandinavianScotch-IrishScottishSeminoleSenegaleseSerbianShoshoneSierra LeoneanSiouxSlavicSlovakSloveneSomaliSouth AfricanSouth AmericanSouth American IndianSoviet UnionSpaniardSpanishSpanish AmericanSpanish American IndianSri LankanSubsaharan AfricanSudaneseSwedishSwissSyrianTaiwaneseThaiTlingit-HaidaTohono O'OdhamTonganTrinidadian and TobagonianTsimshianTurkishU.S. Virgin IslanderUgandanUkrainianUruguayanUteVenezuelanVietnameseWelshWest IndianYakamaYaquiYugoslavianYumanYup'ikZimbabwean
Immigration
NonimmigrantsImmigrantsAfghanistanAfricaAlbaniaArgentinaArmeniaAsiaAustraliaAustriaBahamasBangladeshBarbadosBelarusBelgiumBelizeBoliviaBosnia and HerzegovinaBrazilBulgariaBurma/MyanmarCabo VerdeCambodiaCameroonCanadaCaribbeanCentral AmericaChileChinaColombiaCongoCosta RicaCroatiaCubaCzechoslovakiaDenmarkDominicaDominican RepublicEastern AfricaEastern AsiaEastern EuropeEcuadorEgyptEl SalvadorEritreaEthiopiaEuropeFijiFranceGermanyGhanaGreeceGrenadaGuatemalaGuyanaHaitiHondurasHong KongHungaryIndiaIndonesiaIranIraqIrelandIsraelItalyJamaicaJapanJordanKazakhstanKenyaKoreaKuwaitLaosLatin AmericaLatviaLebanonLiberiaLithuaniaMalaysiaMexicoMicronesiaMiddle AfricaMoldovaMoroccoNepalNetherlandsNicaraguaNigeriaNorth AmericaNorth MacedoniaNorthern AfricaNorthern EuropeNorwayOceaniaPakistanPanamaPeruPhilippinesPolandPortugalRomaniaRussiaSaudi ArabiaScotlandSenegalSerbiaSierra LeoneSingaporeSomaliaSouth AfricaSouth AmericaSouth Central AsiaSouth Eastern AsiaSouthern EuropeSpainSri LankaSt. Vincent and the GrenadinesSudanSwedenSwitzerlandSyriaTaiwanThailandTrinidad and TobagoTurkeyUgandaUkraineUruguayUzbekistanVenezuelaVietnamWest IndiesWestern AfricaWestern AsiaWestern EuropeYemenZaireZimbabweAzores
Immigrants from England
Race
Ancestry
AfghanAfricanAlaska NativeAlaskan AthabascanAlbanianAleutAlsatianAmericanApacheArabArapahoArgentineanArmenianAssyrian/Chaldean/SyriacAustralianAustrianBahamianBangladeshiBarbadianBasqueBelgianBelizeanBermudanBhutaneseBlackfeetBolivianBrazilianBritishBritish West IndianBulgarianBurmeseCajunCambodianCanadianCape VerdeanCarpatho RusynCelticCentral AmericanCentral American IndianCherokeeCheyenneChickasawChileanChineseChippewaChoctawColombianColvilleComancheCosta RicanCreeCreekCroatianCrowCubanCypriotCzechCzechoslovakianDanishDelawareDominicanDutchDutch West IndianEastern EuropeanEcuadorianEgyptianEnglishEstonianEthiopianEuropeanFijianFilipinoFinnishFrenchFrench American IndianFrench CanadianGermanGerman RussianGhanaianGreekGuamanian/ChamorroGuatemalanGuyaneseHaitianHmongHonduranHopiHoumaHungarianIcelanderIndian (Asian)IndonesianInupiatIranianIraqiIrishIroquoisItalianJamaicanJapaneseJordanianKenyanKiowaKoreanLaotianLatvianLebaneseLiberianLithuanianLumbeeLuxembourgerMacedonianMalaysianMalteseMarshalleseMenomineeMexicanMexican American IndianMongolianMoroccanNative HawaiianNavajoNepaleseNew ZealanderNicaraguanNigerianNorthern EuropeanNorwegianOkinawanOsageOttawaPaiutePakistaniPalestinianPanamanianParaguayanPennsylvania GermanPeruvianPimaPolishPortuguesePotawatomiPuebloPuerto RicanPuget Sound SalishRomanianRussianSalvadoranSamoanScandinavianScotch-IrishScottishSeminoleSenegaleseSerbianShoshoneSierra LeoneanSiouxSlavicSlovakSloveneSomaliSouth AfricanSouth AmericanSouth American IndianSoviet UnionSpaniardSpanishSpanish AmericanSpanish American IndianSri LankanSubsaharan AfricanSudaneseSwedishSwissSyrianTaiwaneseThaiTlingit-HaidaTohono O'OdhamTonganTrinidadian and TobagonianTsimshianTurkishU.S. Virgin IslanderUgandanUkrainianUruguayanUteVenezuelanVietnameseWelshWest IndianYakamaYaquiYugoslavianYumanYup'ikZimbabwean
Immigration
NonimmigrantsImmigrantsAfghanistanAfricaAlbaniaArgentinaArmeniaAsiaAustraliaAustriaBahamasBangladeshBarbadosBelarusBelgiumBelizeBoliviaBosnia and HerzegovinaBrazilBulgariaBurma/MyanmarCabo VerdeCambodiaCameroonCanadaCaribbeanCentral AmericaChileChinaColombiaCongoCosta RicaCroatiaCubaCzechoslovakiaDenmarkDominicaDominican RepublicEastern AfricaEastern AsiaEastern EuropeEcuadorEgyptEl SalvadorEnglandEritreaEthiopiaEuropeFijiFranceGermanyGhanaGreeceGrenadaGuatemalaGuyanaHaitiHondurasHong KongHungaryIndiaIndonesiaIranIraqIrelandIsraelItalyJamaicaJapanJordanKazakhstanKenyaKoreaKuwaitLaosLatin AmericaLatviaLebanonLiberiaLithuaniaMalaysiaMexicoMicronesiaMiddle AfricaMoldovaMoroccoNepalNetherlandsNicaraguaNigeriaNorth AmericaNorth MacedoniaNorthern AfricaNorthern EuropeNorwayOceaniaPakistanPanamaPeruPhilippinesPolandPortugalRomaniaRussiaSaudi ArabiaScotlandSenegalSerbiaSierra LeoneSingaporeSomaliaSouth AfricaSouth AmericaSouth Central AsiaSouth Eastern AsiaSouthern EuropeSpainSri LankaSt. Vincent and the GrenadinesSudanSwedenSwitzerlandSyriaTaiwanThailandTrinidad and TobagoTurkeyUgandaUkraineUruguayUzbekistanVenezuelaVietnamWest IndiesWestern AfricaWestern AsiaWestern EuropeYemenZaireZimbabweAzores
7th Grade
Income
Poverty
Unemployment
Labor Participation
Family Structure
Vehicle Availability
Education Level
Disability

7th Grade Comparison

Israelis

Immigrants from England

Excellent
Exceptional
96.3%
7TH GRADE
82.8/ 100
METRIC RATING
148th/ 347
METRIC RANK
96.8%
7TH GRADE
99.5/ 100
METRIC RATING
74th/ 347
METRIC RANK

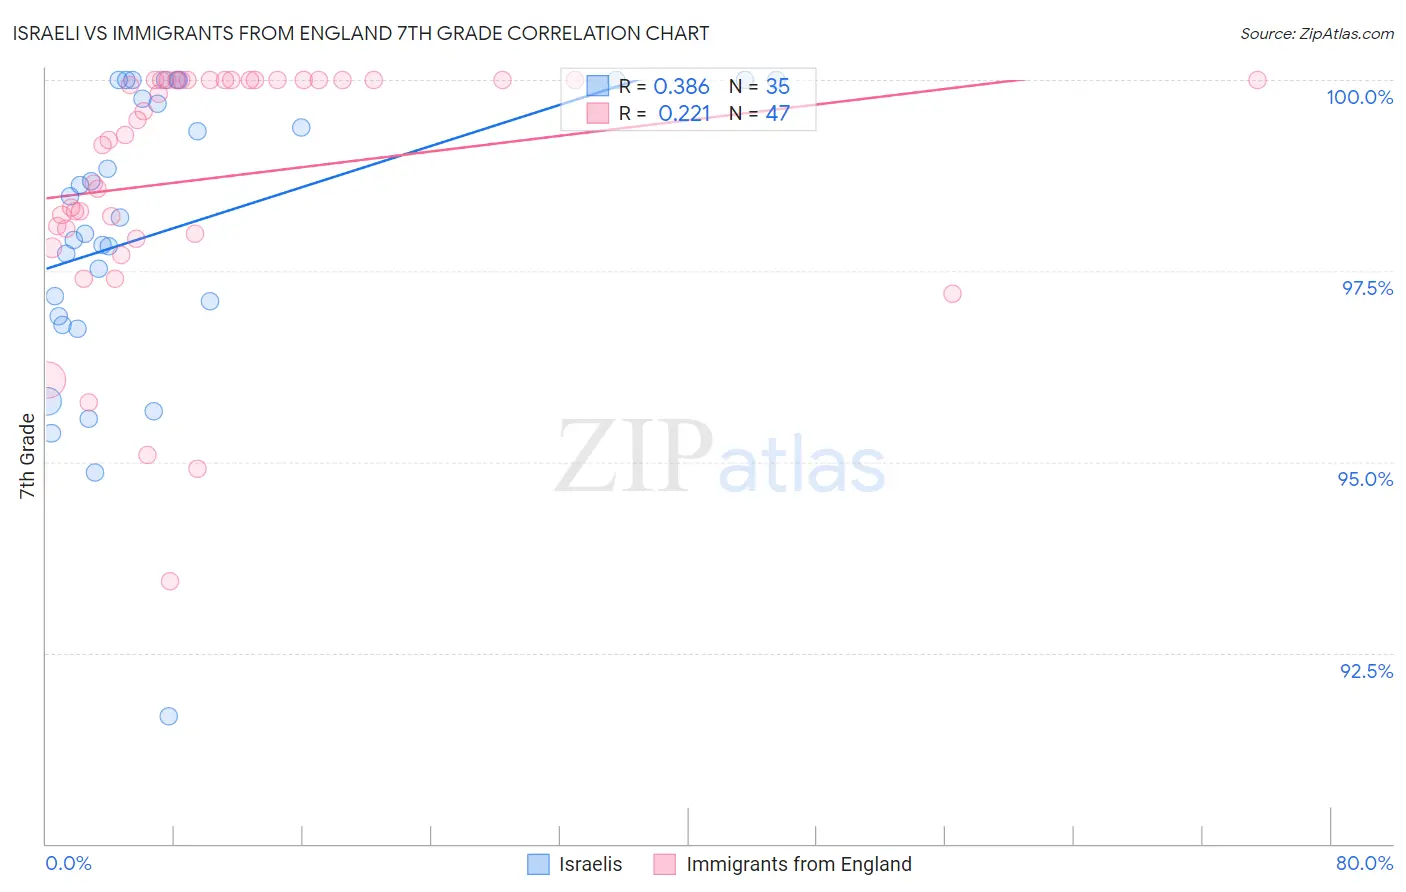
Israeli vs Immigrants from England 7th Grade Correlation Chart

The statistical analysis conducted on geographies consisting of 211,220,151 people shows a mild positive correlation between the proportion of Israelis and percentage of population with at least 7th grade education in the United States with a correlation coefficient (R) of 0.386 and weighted average of 96.3%. Similarly, the statistical analysis conducted on geographies consisting of 391,898,018 people shows a weak positive correlation between the proportion of Immigrants from England and percentage of population with at least 7th grade education in the United States with a correlation coefficient (R) of 0.221 and weighted average of 96.8%, a difference of 0.56%.
Israeli vs Immigrants from England 7th Grade

7th Grade Correlation Summary

MeasurementIsraeliImmigrants from England
Minimum91.7%93.4%
Maximum100.0%100.0%
Range8.3%6.6%
Mean98.0%98.7%
Median98.2%99.3%
Interquartile 25% (IQ1)96.9%98.0%
Interquartile 75% (IQ3)100.0%100.0%
Interquartile Range (IQR)3.1%2.0%
Standard Deviation (Sample)1.9%1.6%
Standard Deviation (Population)1.9%1.6%

Similar Demographics by 7th Grade

Demographics Similar to Israelis by 7th Grade

In terms of 7th grade, the demographic groups most similar to Israelis are French American Indian (96.3%, a difference of 0.0%), Albanian (96.3%, a difference of 0.0%), Immigrants from Belarus (96.3%, a difference of 0.0%), Blackfeet (96.3%, a difference of 0.010%), and Immigrants from Eastern Europe (96.3%, a difference of 0.010%).
DemographicsRating | Rank7th Grade
Immigrants | South Central Asia
87.1
/100
|
#141
Excellent
96.3%
Burmese
87.1
/100
|
#142
Excellent
96.3%
Spanish
86.6
/100
|
#143
Excellent
96.3%
Immigrants | Greece
85.9
/100
|
#144
Excellent
96.3%
Blackfeet
83.9
/100
|
#145
Excellent
96.3%
Immigrants | Eastern Europe
83.7
/100
|
#146
Excellent
96.3%
French American Indians
83.1
/100
|
#147
Excellent
96.3%
Israelis
82.8
/100
|
#148
Excellent
96.3%
Albanians
82.6
/100
|
#149
Excellent
96.3%
Immigrants | Belarus
82.4
/100
|
#150
Excellent
96.3%
Hopi
81.6
/100
|
#151
Excellent
96.3%
Immigrants | Russia
78.4
/100
|
#152
Good
96.2%
Seminole
78.1
/100
|
#153
Good
96.2%
Immigrants | Israel
77.6
/100
|
#154
Good
96.2%
Immigrants | Jordan
77.0
/100
|
#155
Good
96.2%

Demographics Similar to Immigrants from England by 7th Grade

In terms of 7th grade, the demographic groups most similar to Immigrants from England are Zimbabwean (96.8%, a difference of 0.0%), Arapaho (96.8%, a difference of 0.010%), Immigrants from Lithuania (96.8%, a difference of 0.030%), Cajun (96.8%, a difference of 0.030%), and Immigrants from Ireland (96.8%, a difference of 0.030%).
DemographicsRating | Rank7th Grade
Native Hawaiians
99.7
/100
|
#67
Exceptional
96.9%
Immigrants | India
99.6
/100
|
#68
Exceptional
96.9%
Iranians
99.6
/100
|
#69
Exceptional
96.8%
New Zealanders
99.6
/100
|
#70
Exceptional
96.8%
Immigrants | Lithuania
99.6
/100
|
#71
Exceptional
96.8%
Cajuns
99.5
/100
|
#72
Exceptional
96.8%
Arapaho
99.5
/100
|
#73
Exceptional
96.8%
Immigrants | England
99.5
/100
|
#74
Exceptional
96.8%
Zimbabweans
99.5
/100
|
#75
Exceptional
96.8%
Immigrants | Ireland
99.4
/100
|
#76
Exceptional
96.8%
Cherokee
99.4
/100
|
#77
Exceptional
96.8%
Immigrants | Netherlands
99.3
/100
|
#78
Exceptional
96.8%
Cypriots
99.3
/100
|
#79
Exceptional
96.8%
Yugoslavians
99.3
/100
|
#80
Exceptional
96.8%
Delaware
99.2
/100
|
#81
Exceptional
96.8%