West Indian vs Central American Indian 10th Grade
COMPARE
West Indian
Central American Indian
10th Grade
10th Grade Comparison
West Indians
Central American Indians
92.4%
10TH GRADE
0.2/ 100
METRIC RATING
275th/ 347
METRIC RANK
89.7%
10TH GRADE
0.0/ 100
METRIC RATING
326th/ 347
METRIC RANK
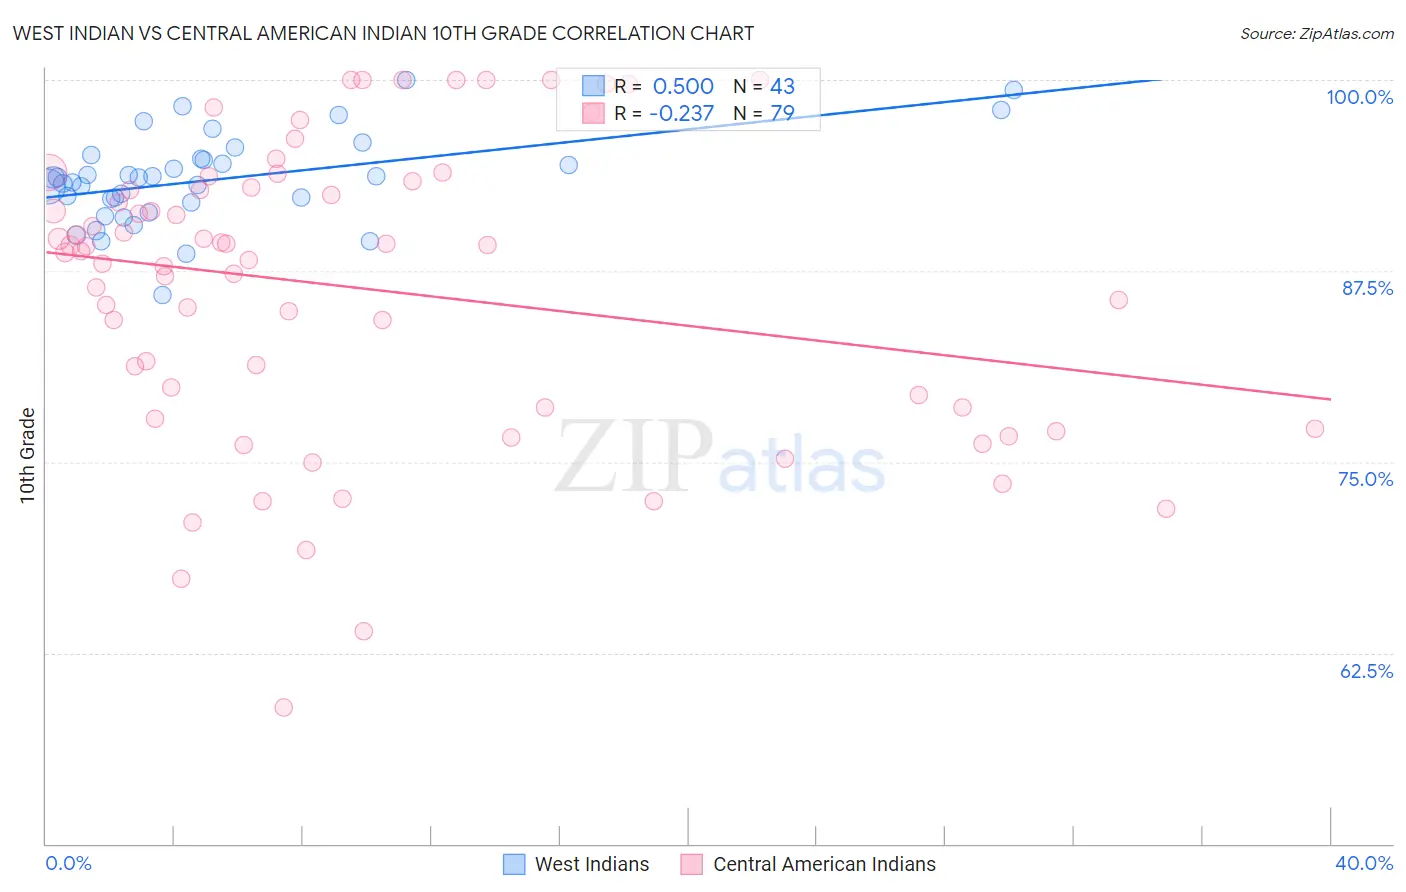
West Indian vs Central American Indian 10th Grade Correlation Chart
The statistical analysis conducted on geographies consisting of 254,059,006 people shows a moderate positive correlation between the proportion of West Indians and percentage of population with at least 10th grade education in the United States with a correlation coefficient (R) of 0.500 and weighted average of 92.4%. Similarly, the statistical analysis conducted on geographies consisting of 326,142,643 people shows a weak negative correlation between the proportion of Central American Indians and percentage of population with at least 10th grade education in the United States with a correlation coefficient (R) of -0.237 and weighted average of 89.7%, a difference of 3.1%.
10th Grade Correlation Summary
| Measurement | West Indian | Central American Indian |
| Minimum | 85.9% | 58.9% |
| Maximum | 100.0% | 100.0% |
| Range | 14.1% | 41.1% |
| Mean | 93.5% | 86.3% |
| Median | 93.6% | 88.8% |
| Interquartile 25% (IQ1) | 92.0% | 78.5% |
| Interquartile 75% (IQ3) | 94.9% | 93.0% |
| Interquartile Range (IQR) | 2.9% | 14.4% |
| Standard Deviation (Sample) | 2.9% | 9.6% |
| Standard Deviation (Population) | 2.9% | 9.6% |
Similar Demographics by 10th Grade
Demographics Similar to West Indians by 10th Grade
In terms of 10th grade, the demographic groups most similar to West Indians are Immigrants from Congo (92.4%, a difference of 0.0%), Trinidadian and Tobagonian (92.4%, a difference of 0.010%), Immigrants from Western Africa (92.5%, a difference of 0.080%), Immigrants from Eritrea (92.5%, a difference of 0.090%), and Immigrants from Colombia (92.5%, a difference of 0.10%).
| Demographics | Rating | Rank | 10th Grade |
| Immigrants | Ghana | 0.3 /100 | #268 | Tragic 92.5% |
| Immigrants | Colombia | 0.3 /100 | #269 | Tragic 92.5% |
| Immigrants | Uruguay | 0.3 /100 | #270 | Tragic 92.5% |
| Immigrants | Eritrea | 0.3 /100 | #271 | Tragic 92.5% |
| Immigrants | Western Africa | 0.3 /100 | #272 | Tragic 92.5% |
| Trinidadians and Tobagonians | 0.2 /100 | #273 | Tragic 92.4% |
| Immigrants | Congo | 0.2 /100 | #274 | Tragic 92.4% |
| West Indians | 0.2 /100 | #275 | Tragic 92.4% |
| Immigrants | Trinidad and Tobago | 0.1 /100 | #276 | Tragic 92.3% |
| Navajo | 0.1 /100 | #277 | Tragic 92.3% |
| Barbadians | 0.1 /100 | #278 | Tragic 92.2% |
| Natives/Alaskans | 0.1 /100 | #279 | Tragic 92.2% |
| Malaysians | 0.1 /100 | #280 | Tragic 92.2% |
| Bangladeshis | 0.1 /100 | #281 | Tragic 92.2% |
| Immigrants | Peru | 0.1 /100 | #282 | Tragic 92.2% |
Demographics Similar to Central American Indians by 10th Grade
In terms of 10th grade, the demographic groups most similar to Central American Indians are Puerto Rican (89.8%, a difference of 0.18%), Immigrants from Armenia (89.9%, a difference of 0.20%), Immigrants from Nicaragua (89.5%, a difference of 0.26%), Immigrants from Cabo Verde (89.5%, a difference of 0.27%), and Dominican (89.4%, a difference of 0.37%).
| Demographics | Rating | Rank | 10th Grade |
| Nicaraguans | 0.0 /100 | #319 | Tragic 90.2% |
| Houma | 0.0 /100 | #320 | Tragic 90.2% |
| Belizeans | 0.0 /100 | #321 | Tragic 90.2% |
| Tohono O'odham | 0.0 /100 | #322 | Tragic 90.1% |
| Immigrants | Belize | 0.0 /100 | #323 | Tragic 90.1% |
| Immigrants | Armenia | 0.0 /100 | #324 | Tragic 89.9% |
| Puerto Ricans | 0.0 /100 | #325 | Tragic 89.8% |
| Central American Indians | 0.0 /100 | #326 | Tragic 89.7% |
| Immigrants | Nicaragua | 0.0 /100 | #327 | Tragic 89.5% |
| Immigrants | Cabo Verde | 0.0 /100 | #328 | Tragic 89.5% |
| Dominicans | 0.0 /100 | #329 | Tragic 89.4% |
| Immigrants | Yemen | 0.0 /100 | #330 | Tragic 89.1% |
| Mexican American Indians | 0.0 /100 | #331 | Tragic 89.0% |
| Immigrants | Azores | 0.0 /100 | #332 | Tragic 89.0% |
| Hondurans | 0.0 /100 | #333 | Tragic 89.0% |