Immigrants from Haiti vs Immigrants from Sierra Leone 10th Grade

COMPARE

Immigrants from Haiti
Race
Ancestry
AfghanAfricanAlaska NativeAlaskan AthabascanAlbanianAleutAlsatianAmericanApacheArabArapahoArgentineanArmenianAssyrian/Chaldean/SyriacAustralianAustrianBahamianBangladeshiBarbadianBasqueBelgianBelizeanBermudanBhutaneseBlackfeetBolivianBrazilianBritishBritish West IndianBulgarianBurmeseCajunCambodianCanadianCape VerdeanCarpatho RusynCelticCentral AmericanCentral American IndianCherokeeCheyenneChickasawChileanChineseChippewaChoctawColombianColvilleComancheCosta RicanCreeCreekCroatianCrowCubanCypriotCzechCzechoslovakianDanishDelawareDominicanDutchDutch West IndianEastern EuropeanEcuadorianEgyptianEnglishEstonianEthiopianEuropeanFijianFilipinoFinnishFrenchFrench American IndianFrench CanadianGermanGerman RussianGhanaianGreekGuamanian/ChamorroGuatemalanGuyaneseHaitianHmongHonduranHopiHoumaHungarianIcelanderIndian (Asian)IndonesianInupiatIranianIraqiIrishIroquoisIsraeliItalianJamaicanJapaneseJordanianKenyanKiowaKoreanLaotianLatvianLebaneseLiberianLithuanianLumbeeLuxembourgerMacedonianMalaysianMalteseMarshalleseMenomineeMexicanMexican American IndianMongolianMoroccanNative HawaiianNavajoNepaleseNew ZealanderNicaraguanNigerianNorthern EuropeanNorwegianOkinawanOsageOttawaPaiutePakistaniPalestinianPanamanianParaguayanPennsylvania GermanPeruvianPimaPolishPortuguesePotawatomiPuebloPuerto RicanPuget Sound SalishRomanianRussianSalvadoranSamoanScandinavianScotch-IrishScottishSeminoleSenegaleseSerbianShoshoneSierra LeoneanSiouxSlavicSlovakSloveneSomaliSouth AfricanSouth AmericanSouth American IndianSoviet UnionSpaniardSpanishSpanish AmericanSpanish American IndianSri LankanSubsaharan AfricanSudaneseSwedishSwissSyrianTaiwaneseThaiTlingit-HaidaTohono O'OdhamTonganTrinidadian and TobagonianTsimshianTurkishU.S. Virgin IslanderUgandanUkrainianUruguayanUteVenezuelanVietnameseWelshWest IndianYakamaYaquiYugoslavianYumanYup'ikZimbabwean
Immigration
NonimmigrantsImmigrantsAfghanistanAfricaAlbaniaArgentinaArmeniaAsiaAustraliaAustriaBahamasBangladeshBarbadosBelarusBelgiumBelizeBoliviaBosnia and HerzegovinaBrazilBulgariaBurma/MyanmarCabo VerdeCambodiaCameroonCanadaCaribbeanCentral AmericaChileChinaColombiaCongoCosta RicaCroatiaCubaCzechoslovakiaDenmarkDominicaDominican RepublicEastern AfricaEastern AsiaEastern EuropeEcuadorEgyptEl SalvadorEnglandEritreaEthiopiaEuropeFijiFranceGermanyGhanaGreeceGrenadaGuatemalaGuyanaHaitiHondurasHong KongHungaryIndiaIndonesiaIranIraqIrelandIsraelItalyJamaicaJapanJordanKazakhstanKenyaKoreaKuwaitLaosLatin AmericaLatviaLebanonLiberiaLithuaniaMalaysiaMexicoMicronesiaMiddle AfricaMoldovaMoroccoNepalNetherlandsNicaraguaNigeriaNorth AmericaNorth MacedoniaNorthern AfricaNorthern EuropeNorwayOceaniaPakistanPanamaPeruPhilippinesPolandPortugalRomaniaRussiaSaudi ArabiaScotlandSenegalSerbiaSingaporeSomaliaSouth AfricaSouth AmericaSouth Central AsiaSouth Eastern AsiaSouthern EuropeSpainSri LankaSt. Vincent and the GrenadinesSudanSwedenSwitzerlandSyriaTaiwanThailandTrinidad and TobagoTurkeyUgandaUkraineUruguayUzbekistanVenezuelaVietnamWest IndiesWestern AfricaWestern AsiaWestern EuropeYemenZaireZimbabweAzores
Immigrants from Sierra Leone
Race
Ancestry
AfghanAfricanAlaska NativeAlaskan AthabascanAlbanianAleutAlsatianAmericanApacheArabArapahoArgentineanArmenianAssyrian/Chaldean/SyriacAustralianAustrianBahamianBangladeshiBarbadianBasqueBelgianBelizeanBermudanBhutaneseBlackfeetBolivianBrazilianBritishBritish West IndianBulgarianBurmeseCajunCambodianCanadianCape VerdeanCarpatho RusynCelticCentral AmericanCentral American IndianCherokeeCheyenneChickasawChileanChineseChippewaChoctawColombianColvilleComancheCosta RicanCreeCreekCroatianCrowCubanCypriotCzechCzechoslovakianDanishDelawareDominicanDutchDutch West IndianEastern EuropeanEcuadorianEgyptianEnglishEstonianEthiopianEuropeanFijianFilipinoFinnishFrenchFrench American IndianFrench CanadianGermanGerman RussianGhanaianGreekGuamanian/ChamorroGuatemalanGuyaneseHaitianHmongHonduranHopiHoumaHungarianIcelanderIndian (Asian)IndonesianInupiatIranianIraqiIrishIroquoisIsraeliItalianJamaicanJapaneseJordanianKenyanKiowaKoreanLaotianLatvianLebaneseLiberianLithuanianLumbeeLuxembourgerMacedonianMalaysianMalteseMarshalleseMenomineeMexicanMexican American IndianMongolianMoroccanNative HawaiianNavajoNepaleseNew ZealanderNicaraguanNigerianNorthern EuropeanNorwegianOkinawanOsageOttawaPaiutePakistaniPalestinianPanamanianParaguayanPennsylvania GermanPeruvianPimaPolishPortuguesePotawatomiPuebloPuerto RicanPuget Sound SalishRomanianRussianSalvadoranSamoanScandinavianScotch-IrishScottishSeminoleSenegaleseSerbianShoshoneSierra LeoneanSiouxSlavicSlovakSloveneSomaliSouth AfricanSouth AmericanSouth American IndianSoviet UnionSpaniardSpanishSpanish AmericanSpanish American IndianSri LankanSubsaharan AfricanSudaneseSwedishSwissSyrianTaiwaneseThaiTlingit-HaidaTohono O'OdhamTonganTrinidadian and TobagonianTsimshianTurkishU.S. Virgin IslanderUgandanUkrainianUruguayanUteVenezuelanVietnameseWelshWest IndianYakamaYaquiYugoslavianYumanYup'ikZimbabwean
Immigration
NonimmigrantsImmigrantsAfghanistanAfricaAlbaniaArgentinaArmeniaAsiaAustraliaAustriaBahamasBangladeshBarbadosBelarusBelgiumBelizeBoliviaBosnia and HerzegovinaBrazilBulgariaBurma/MyanmarCabo VerdeCambodiaCameroonCanadaCaribbeanCentral AmericaChileChinaColombiaCongoCosta RicaCroatiaCubaCzechoslovakiaDenmarkDominicaDominican RepublicEastern AfricaEastern AsiaEastern EuropeEcuadorEgyptEl SalvadorEnglandEritreaEthiopiaEuropeFijiFranceGermanyGhanaGreeceGrenadaGuatemalaGuyanaHondurasHong KongHungaryIndiaIndonesiaIranIraqIrelandIsraelItalyJamaicaJapanJordanKazakhstanKenyaKoreaKuwaitLaosLatin AmericaLatviaLebanonLiberiaLithuaniaMalaysiaMexicoMicronesiaMiddle AfricaMoldovaMoroccoNepalNetherlandsNicaraguaNigeriaNorth AmericaNorth MacedoniaNorthern AfricaNorthern EuropeNorwayOceaniaPakistanPanamaPeruPhilippinesPolandPortugalRomaniaRussiaSaudi ArabiaScotlandSenegalSerbiaSierra LeoneSingaporeSomaliaSouth AfricaSouth AmericaSouth Central AsiaSouth Eastern AsiaSouthern EuropeSpainSri LankaSt. Vincent and the GrenadinesSudanSwedenSwitzerlandSyriaTaiwanThailandTrinidad and TobagoTurkeyUgandaUkraineUruguayUzbekistanVenezuelaVietnamWest IndiesWestern AfricaWestern AsiaWestern EuropeYemenZaireZimbabweAzores
10th Grade
Income
Poverty
Unemployment
Labor Participation
Family Structure
Vehicle Availability
Education Level
Disability

10th Grade Comparison

Immigrants from Haiti

Immigrants from Sierra Leone

Tragic
Tragic
91.4%
10TH GRADE
0.0/ 100
METRIC RATING
299th/ 347
METRIC RANK
93.2%
10TH GRADE
7.6/ 100
METRIC RATING
223rd/ 347
METRIC RANK

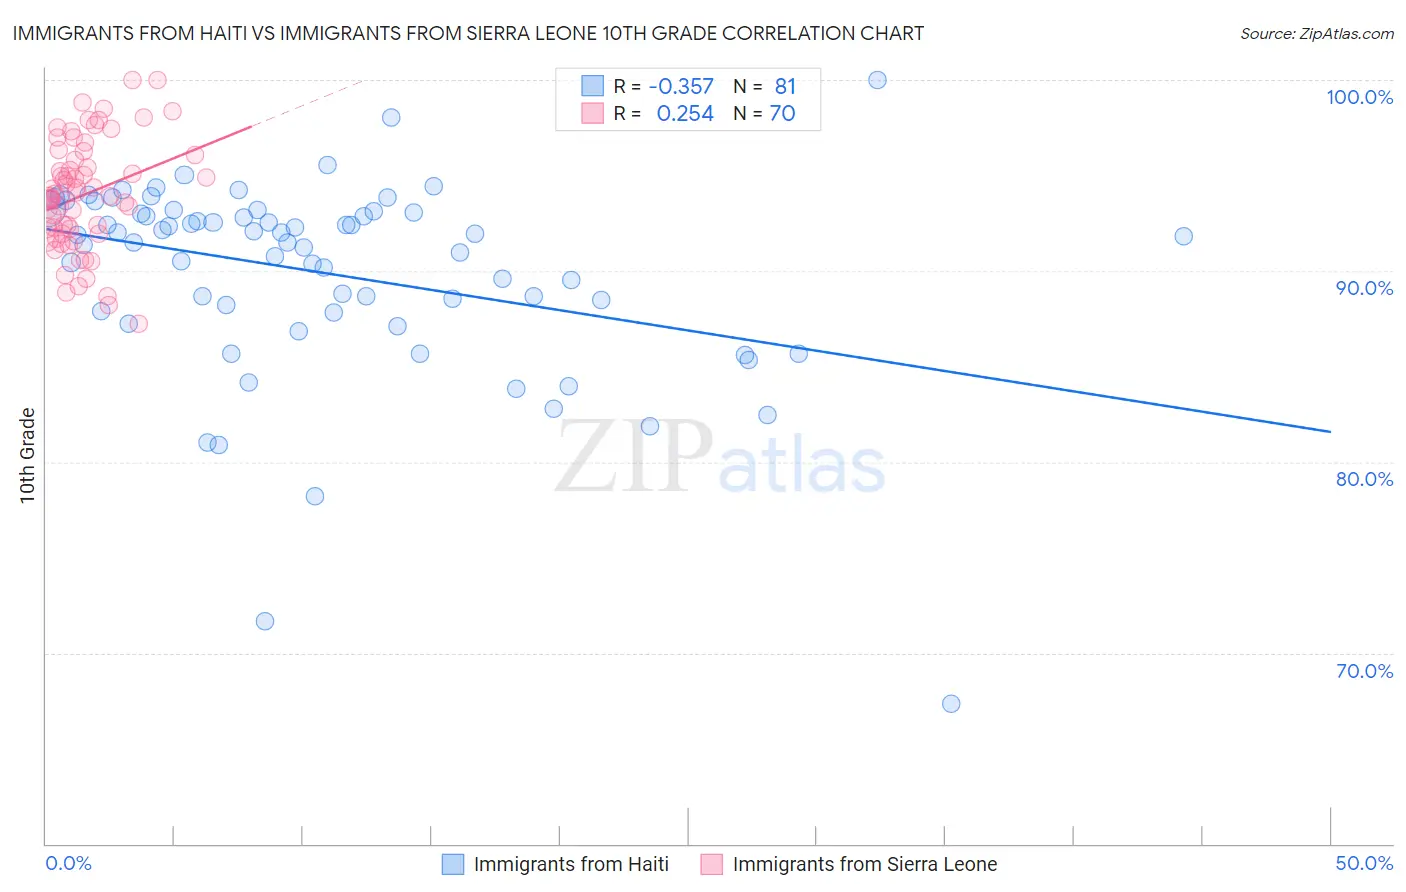
Immigrants from Haiti vs Immigrants from Sierra Leone 10th Grade Correlation Chart

The statistical analysis conducted on geographies consisting of 225,286,322 people shows a mild negative correlation between the proportion of Immigrants from Haiti and percentage of population with at least 10th grade education in the United States with a correlation coefficient (R) of -0.357 and weighted average of 91.4%. Similarly, the statistical analysis conducted on geographies consisting of 101,634,956 people shows a weak positive correlation between the proportion of Immigrants from Sierra Leone and percentage of population with at least 10th grade education in the United States with a correlation coefficient (R) of 0.254 and weighted average of 93.2%, a difference of 2.0%.
Immigrants from Haiti vs Immigrants from Sierra Leone 10th Grade

10th Grade Correlation Summary

MeasurementImmigrants from HaitiImmigrants from Sierra Leone
Minimum67.3%87.2%
Maximum100.0%100.0%
Range32.7%12.8%
Mean89.9%94.0%
Median91.8%94.0%
Interquartile 25% (IQ1)87.9%91.9%
Interquartile 75% (IQ3)93.1%96.1%
Interquartile Range (IQR)5.2%4.1%
Standard Deviation (Sample)5.2%2.9%
Standard Deviation (Population)5.2%2.9%

Similar Demographics by 10th Grade

Demographics Similar to Immigrants from Haiti by 10th Grade

In terms of 10th grade, the demographic groups most similar to Immigrants from Haiti are Guyanese (91.4%, a difference of 0.050%), Cuban (91.5%, a difference of 0.080%), Fijian (91.5%, a difference of 0.10%), Japanese (91.2%, a difference of 0.19%), and Immigrants from Guyana (91.2%, a difference of 0.20%).
DemographicsRating | Rank10th Grade
Immigrants | Burma/Myanmar
0.0
/100
|
#292
Tragic
91.8%
Indonesians
0.0
/100
|
#293
Tragic
91.8%
Haitians
0.0
/100
|
#294
Tragic
91.8%
Lumbee
0.0
/100
|
#295
Tragic
91.7%
Immigrants | Grenada
0.0
/100
|
#296
Tragic
91.6%
Fijians
0.0
/100
|
#297
Tragic
91.5%
Cubans
0.0
/100
|
#298
Tragic
91.5%
Immigrants | Haiti
0.0
/100
|
#299
Tragic
91.4%
Guyanese
0.0
/100
|
#300
Tragic
91.4%
Japanese
0.0
/100
|
#301
Tragic
91.2%
Immigrants | Guyana
0.0
/100
|
#302
Tragic
91.2%
Immigrants | Vietnam
0.0
/100
|
#303
Tragic
91.2%
Pima
0.0
/100
|
#304
Tragic
91.2%
Immigrants | Dominica
0.0
/100
|
#305
Tragic
91.1%
Yaqui
0.0
/100
|
#306
Tragic
91.1%

Demographics Similar to Immigrants from Sierra Leone by 10th Grade

In terms of 10th grade, the demographic groups most similar to Immigrants from Sierra Leone are Ethiopian (93.2%, a difference of 0.010%), Bolivian (93.2%, a difference of 0.030%), Immigrants from Southern Europe (93.2%, a difference of 0.040%), Tongan (93.3%, a difference of 0.050%), and Somali (93.2%, a difference of 0.050%).
DemographicsRating | Rank10th Grade
Immigrants | Eastern Africa
14.7
/100
|
#216
Poor
93.4%
Portuguese
12.1
/100
|
#217
Poor
93.3%
Immigrants | Liberia
10.2
/100
|
#218
Poor
93.3%
Seminole
10.2
/100
|
#219
Poor
93.3%
Tongans
9.5
/100
|
#220
Tragic
93.3%
Immigrants | Southern Europe
8.9
/100
|
#221
Tragic
93.2%
Ethiopians
7.9
/100
|
#222
Tragic
93.2%
Immigrants | Sierra Leone
7.6
/100
|
#223
Tragic
93.2%
Bolivians
6.7
/100
|
#224
Tragic
93.2%
Somalis
6.2
/100
|
#225
Tragic
93.2%
Koreans
6.1
/100
|
#226
Tragic
93.2%
Blacks/African Americans
6.0
/100
|
#227
Tragic
93.2%
Immigrants | China
5.9
/100
|
#228
Tragic
93.2%
Immigrants | Ethiopia
5.1
/100
|
#229
Tragic
93.1%
Immigrants | Africa
5.0
/100
|
#230
Tragic
93.1%