Sri Lankan vs Immigrants from Sierra Leone 10th Grade
COMPARE
Sri Lankan
Immigrants from Sierra Leone
10th Grade
10th Grade Comparison
Sri Lankans
Immigrants from Sierra Leone
91.8%
10TH GRADE
0.0/ 100
METRIC RATING
289th/ 347
METRIC RANK
93.2%
10TH GRADE
7.6/ 100
METRIC RATING
223rd/ 347
METRIC RANK
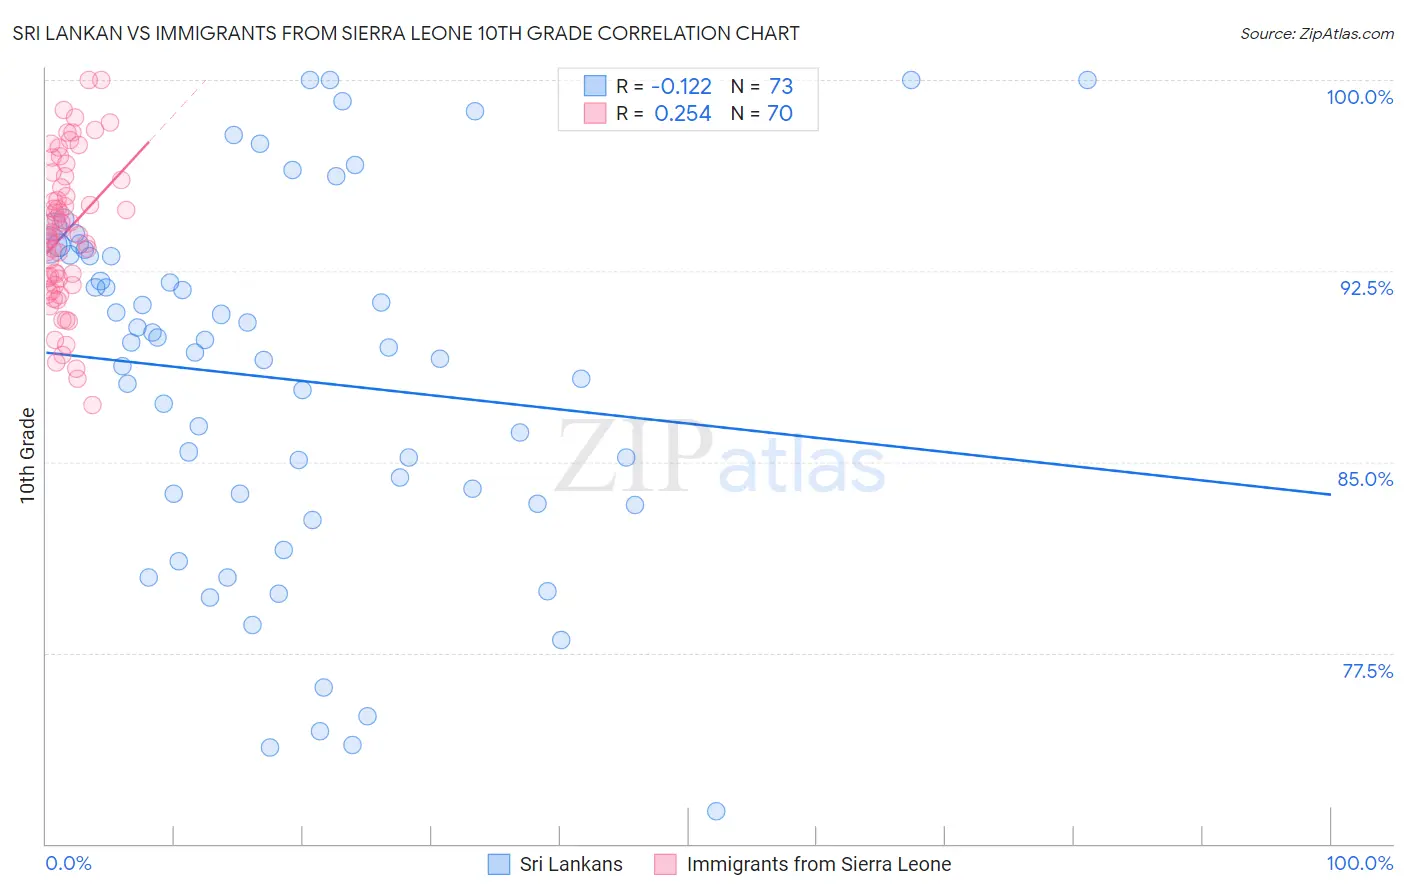
Sri Lankan vs Immigrants from Sierra Leone 10th Grade Correlation Chart
The statistical analysis conducted on geographies consisting of 440,593,537 people shows a poor negative correlation between the proportion of Sri Lankans and percentage of population with at least 10th grade education in the United States with a correlation coefficient (R) of -0.122 and weighted average of 91.8%. Similarly, the statistical analysis conducted on geographies consisting of 101,634,956 people shows a weak positive correlation between the proportion of Immigrants from Sierra Leone and percentage of population with at least 10th grade education in the United States with a correlation coefficient (R) of 0.254 and weighted average of 93.2%, a difference of 1.5%.
10th Grade Correlation Summary
| Measurement | Sri Lankan | Immigrants from Sierra Leone |
| Minimum | 71.3% | 87.2% |
| Maximum | 100.0% | 100.0% |
| Range | 28.7% | 12.8% |
| Mean | 88.2% | 94.0% |
| Median | 89.5% | 94.0% |
| Interquartile 25% (IQ1) | 83.6% | 91.9% |
| Interquartile 75% (IQ3) | 93.2% | 96.1% |
| Interquartile Range (IQR) | 9.7% | 4.1% |
| Standard Deviation (Sample) | 7.1% | 2.9% |
| Standard Deviation (Population) | 7.0% | 2.9% |
Similar Demographics by 10th Grade
Demographics Similar to Sri Lankans by 10th Grade
In terms of 10th grade, the demographic groups most similar to Sri Lankans are British West Indian (91.8%, a difference of 0.020%), Immigrants from West Indies (91.8%, a difference of 0.030%), Immigrants from Burma/Myanmar (91.8%, a difference of 0.030%), Pennsylvania German (91.9%, a difference of 0.040%), and Immigrants from Laos (91.9%, a difference of 0.040%).
| Demographics | Rating | Rank | 10th Grade |
| Immigrants | Peru | 0.1 /100 | #282 | Tragic 92.2% |
| Immigrants | St. Vincent and the Grenadines | 0.0 /100 | #283 | Tragic 92.1% |
| Immigrants | Barbados | 0.0 /100 | #284 | Tragic 92.1% |
| Immigrants | South Eastern Asia | 0.0 /100 | #285 | Tragic 92.1% |
| Yuman | 0.0 /100 | #286 | Tragic 92.0% |
| Pennsylvania Germans | 0.0 /100 | #287 | Tragic 91.9% |
| Immigrants | Laos | 0.0 /100 | #288 | Tragic 91.9% |
| Sri Lankans | 0.0 /100 | #289 | Tragic 91.8% |
| British West Indians | 0.0 /100 | #290 | Tragic 91.8% |
| Immigrants | West Indies | 0.0 /100 | #291 | Tragic 91.8% |
| Immigrants | Burma/Myanmar | 0.0 /100 | #292 | Tragic 91.8% |
| Indonesians | 0.0 /100 | #293 | Tragic 91.8% |
| Haitians | 0.0 /100 | #294 | Tragic 91.8% |
| Lumbee | 0.0 /100 | #295 | Tragic 91.7% |
| Immigrants | Grenada | 0.0 /100 | #296 | Tragic 91.6% |
Demographics Similar to Immigrants from Sierra Leone by 10th Grade
In terms of 10th grade, the demographic groups most similar to Immigrants from Sierra Leone are Ethiopian (93.2%, a difference of 0.010%), Bolivian (93.2%, a difference of 0.030%), Immigrants from Southern Europe (93.2%, a difference of 0.040%), Tongan (93.3%, a difference of 0.050%), and Somali (93.2%, a difference of 0.050%).
| Demographics | Rating | Rank | 10th Grade |
| Immigrants | Eastern Africa | 14.7 /100 | #216 | Poor 93.4% |
| Portuguese | 12.1 /100 | #217 | Poor 93.3% |
| Immigrants | Liberia | 10.2 /100 | #218 | Poor 93.3% |
| Seminole | 10.2 /100 | #219 | Poor 93.3% |
| Tongans | 9.5 /100 | #220 | Tragic 93.3% |
| Immigrants | Southern Europe | 8.9 /100 | #221 | Tragic 93.2% |
| Ethiopians | 7.9 /100 | #222 | Tragic 93.2% |
| Immigrants | Sierra Leone | 7.6 /100 | #223 | Tragic 93.2% |
| Bolivians | 6.7 /100 | #224 | Tragic 93.2% |
| Somalis | 6.2 /100 | #225 | Tragic 93.2% |
| Koreans | 6.1 /100 | #226 | Tragic 93.2% |
| Blacks/African Americans | 6.0 /100 | #227 | Tragic 93.2% |
| Immigrants | China | 5.9 /100 | #228 | Tragic 93.2% |
| Immigrants | Ethiopia | 5.1 /100 | #229 | Tragic 93.1% |
| Immigrants | Africa | 5.0 /100 | #230 | Tragic 93.1% |