Immigrants from Southern Europe vs Immigrants from Kuwait Doctorate Degree
COMPARE
Immigrants from Southern Europe
Immigrants from Kuwait
Doctorate Degree
Doctorate Degree Comparison
Immigrants from Southern Europe
Immigrants from Kuwait
2.0%
DOCTORATE DEGREE
94.7/ 100
METRIC RATING
122nd/ 347
METRIC RANK
2.6%
DOCTORATE DEGREE
100.0/ 100
METRIC RATING
37th/ 347
METRIC RANK
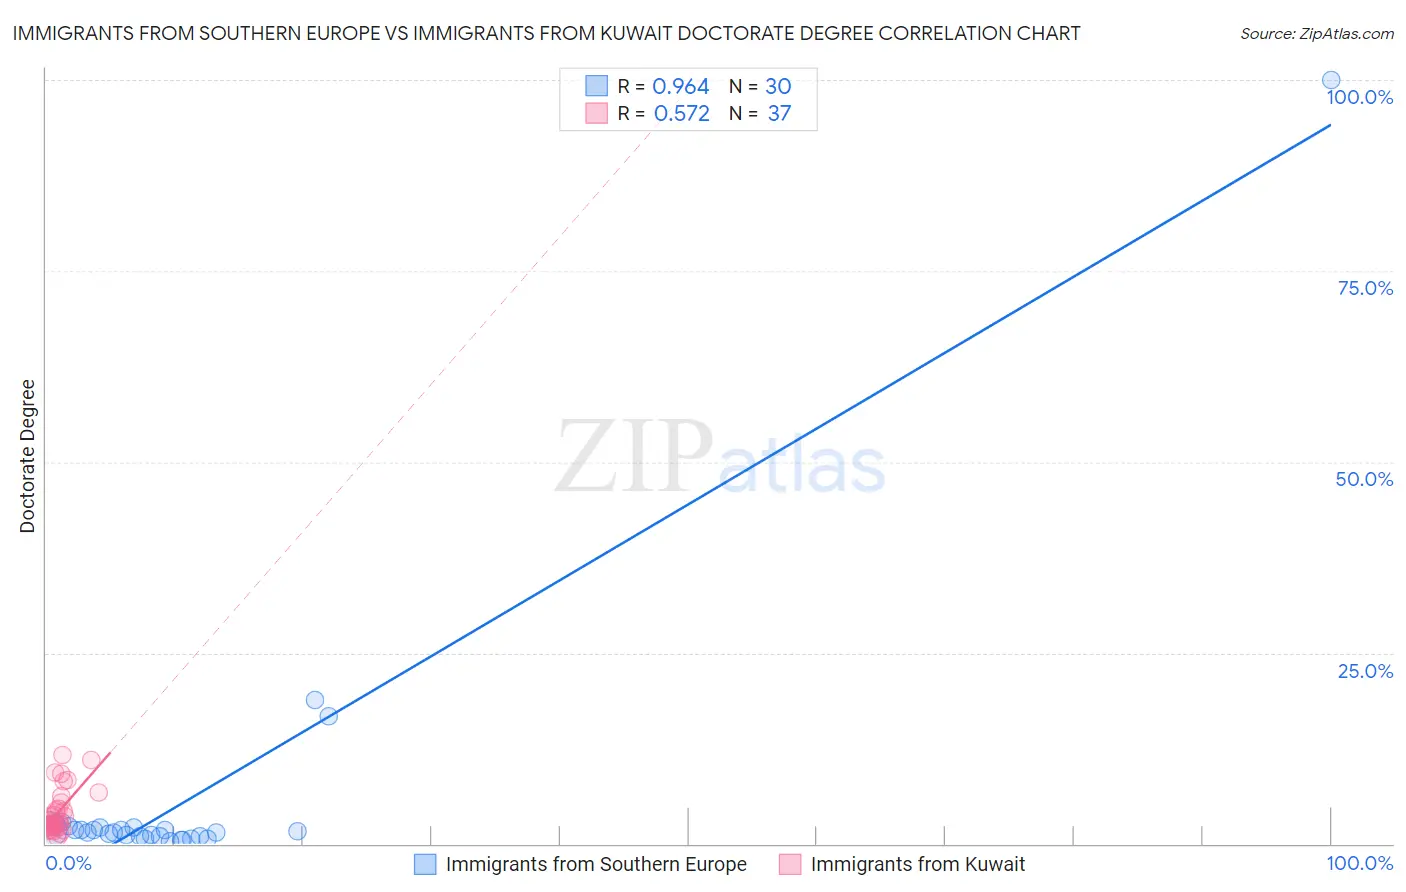
Immigrants from Southern Europe vs Immigrants from Kuwait Doctorate Degree Correlation Chart
The statistical analysis conducted on geographies consisting of 399,415,289 people shows a perfect positive correlation between the proportion of Immigrants from Southern Europe and percentage of population with at least doctorate degree education in the United States with a correlation coefficient (R) of 0.964 and weighted average of 2.0%. Similarly, the statistical analysis conducted on geographies consisting of 136,719,755 people shows a substantial positive correlation between the proportion of Immigrants from Kuwait and percentage of population with at least doctorate degree education in the United States with a correlation coefficient (R) of 0.572 and weighted average of 2.6%, a difference of 25.7%.
Doctorate Degree Correlation Summary
| Measurement | Immigrants from Southern Europe | Immigrants from Kuwait |
| Minimum | 0.40% | 0.82% |
| Maximum | 100.0% | 11.6% |
| Range | 99.6% | 10.8% |
| Mean | 5.8% | 4.1% |
| Median | 1.5% | 2.6% |
| Interquartile 25% (IQ1) | 1.0% | 2.2% |
| Interquartile 75% (IQ3) | 2.1% | 4.9% |
| Interquartile Range (IQR) | 1.1% | 2.7% |
| Standard Deviation (Sample) | 18.3% | 2.8% |
| Standard Deviation (Population) | 18.0% | 2.8% |
Similar Demographics by Doctorate Degree
Demographics Similar to Immigrants from Southern Europe by Doctorate Degree
In terms of doctorate degree, the demographic groups most similar to Immigrants from Southern Europe are Immigrants from Jordan (2.0%, a difference of 0.030%), Croatian (2.0%, a difference of 0.46%), Immigrants from Morocco (2.0%, a difference of 0.50%), Pakistani (2.0%, a difference of 0.79%), and Icelander (2.1%, a difference of 0.92%).
| Demographics | Rating | Rank | Doctorate Degree |
| Taiwanese | 96.7 /100 | #115 | Exceptional 2.1% |
| Maltese | 96.2 /100 | #116 | Exceptional 2.1% |
| Lebanese | 96.0 /100 | #117 | Exceptional 2.1% |
| Icelanders | 96.0 /100 | #118 | Exceptional 2.1% |
| Pakistanis | 95.8 /100 | #119 | Exceptional 2.0% |
| Immigrants | Morocco | 95.5 /100 | #120 | Exceptional 2.0% |
| Immigrants | Jordan | 94.8 /100 | #121 | Exceptional 2.0% |
| Immigrants | Southern Europe | 94.7 /100 | #122 | Exceptional 2.0% |
| Croatians | 94.0 /100 | #123 | Exceptional 2.0% |
| Ute | 93.2 /100 | #124 | Exceptional 2.0% |
| Moroccans | 93.0 /100 | #125 | Exceptional 2.0% |
| Jordanians | 92.1 /100 | #126 | Exceptional 2.0% |
| Palestinians | 92.0 /100 | #127 | Exceptional 2.0% |
| Immigrants | Zaire | 91.1 /100 | #128 | Exceptional 2.0% |
| Canadians | 90.6 /100 | #129 | Exceptional 2.0% |
Demographics Similar to Immigrants from Kuwait by Doctorate Degree
In terms of doctorate degree, the demographic groups most similar to Immigrants from Kuwait are Russian (2.6%, a difference of 0.15%), Immigrants from Spain (2.6%, a difference of 0.26%), Immigrants from Malaysia (2.6%, a difference of 0.32%), Cypriot (2.6%, a difference of 0.38%), and Cambodian (2.6%, a difference of 0.50%).
| Demographics | Rating | Rank | Doctorate Degree |
| Immigrants | Korea | 100.0 /100 | #30 | Exceptional 2.6% |
| Latvians | 100.0 /100 | #31 | Exceptional 2.6% |
| Immigrants | Northern Europe | 100.0 /100 | #32 | Exceptional 2.6% |
| Cambodians | 100.0 /100 | #33 | Exceptional 2.6% |
| Cypriots | 100.0 /100 | #34 | Exceptional 2.6% |
| Immigrants | Malaysia | 100.0 /100 | #35 | Exceptional 2.6% |
| Immigrants | Spain | 100.0 /100 | #36 | Exceptional 2.6% |
| Immigrants | Kuwait | 100.0 /100 | #37 | Exceptional 2.6% |
| Russians | 100.0 /100 | #38 | Exceptional 2.6% |
| Immigrants | Ireland | 100.0 /100 | #39 | Exceptional 2.5% |
| Estonians | 100.0 /100 | #40 | Exceptional 2.5% |
| Immigrants | Russia | 100.0 /100 | #41 | Exceptional 2.5% |
| New Zealanders | 100.0 /100 | #42 | Exceptional 2.5% |
| Soviet Union | 100.0 /100 | #43 | Exceptional 2.5% |
| Immigrants | Netherlands | 100.0 /100 | #44 | Exceptional 2.5% |