Irish vs Immigrants from Iraq 2nd Grade
COMPARE
Irish
Immigrants from Iraq
2nd Grade
2nd Grade Comparison
Irish
Immigrants from Iraq
98.6%
2ND GRADE
100.0/ 100
METRIC RATING
18th/ 347
METRIC RANK
97.5%
2ND GRADE
1.0/ 100
METRIC RATING
244th/ 347
METRIC RANK
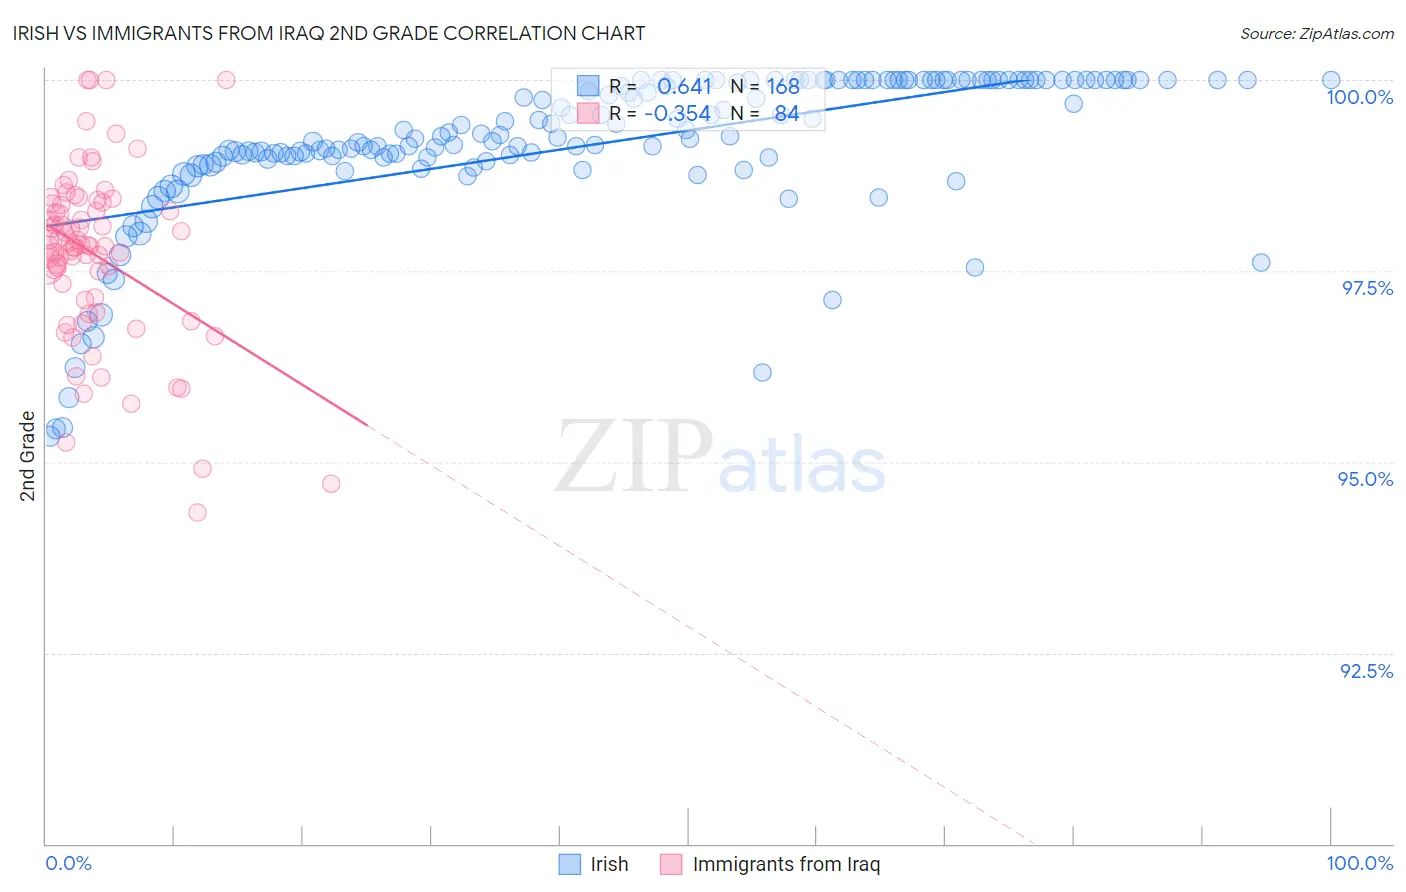
Irish vs Immigrants from Iraq 2nd Grade Correlation Chart
The statistical analysis conducted on geographies consisting of 580,708,963 people shows a significant positive correlation between the proportion of Irish and percentage of population with at least 2nd grade education in the United States with a correlation coefficient (R) of 0.641 and weighted average of 98.6%. Similarly, the statistical analysis conducted on geographies consisting of 194,726,982 people shows a mild negative correlation between the proportion of Immigrants from Iraq and percentage of population with at least 2nd grade education in the United States with a correlation coefficient (R) of -0.354 and weighted average of 97.5%, a difference of 1.1%.
2nd Grade Correlation Summary
| Measurement | Irish | Immigrants from Iraq |
| Minimum | 95.3% | 94.3% |
| Maximum | 100.0% | 100.0% |
| Range | 4.7% | 5.7% |
| Mean | 99.2% | 97.7% |
| Median | 99.3% | 97.8% |
| Interquartile 25% (IQ1) | 98.9% | 97.1% |
| Interquartile 75% (IQ3) | 100.0% | 98.4% |
| Interquartile Range (IQR) | 1.1% | 1.2% |
| Standard Deviation (Sample) | 1.00% | 1.1% |
| Standard Deviation (Population) | 0.99% | 1.1% |
Similar Demographics by 2nd Grade
Demographics Similar to Irish by 2nd Grade
In terms of 2nd grade, the demographic groups most similar to Irish are Aleut (98.6%, a difference of 0.0%), Finnish (98.5%, a difference of 0.010%), Sioux (98.5%, a difference of 0.010%), Lithuanian (98.5%, a difference of 0.010%), and Polish (98.5%, a difference of 0.010%).
| Demographics | Rating | Rank | 2nd Grade |
| Tlingit-Haida | 100.0 /100 | #11 | Exceptional 98.6% |
| Carpatho Rusyns | 100.0 /100 | #12 | Exceptional 98.6% |
| English | 100.0 /100 | #13 | Exceptional 98.6% |
| Swedes | 100.0 /100 | #14 | Exceptional 98.6% |
| Scottish | 100.0 /100 | #15 | Exceptional 98.6% |
| Dutch | 100.0 /100 | #16 | Exceptional 98.6% |
| Aleuts | 100.0 /100 | #17 | Exceptional 98.6% |
| Irish | 100.0 /100 | #18 | Exceptional 98.6% |
| Finns | 100.0 /100 | #19 | Exceptional 98.5% |
| Sioux | 100.0 /100 | #20 | Exceptional 98.5% |
| Lithuanians | 100.0 /100 | #21 | Exceptional 98.5% |
| Poles | 100.0 /100 | #22 | Exceptional 98.5% |
| Danes | 100.0 /100 | #23 | Exceptional 98.5% |
| Pennsylvania Germans | 100.0 /100 | #24 | Exceptional 98.5% |
| Scotch-Irish | 100.0 /100 | #25 | Exceptional 98.5% |
Demographics Similar to Immigrants from Iraq by 2nd Grade
In terms of 2nd grade, the demographic groups most similar to Immigrants from Iraq are Asian (97.5%, a difference of 0.010%), Immigrants from Eastern Africa (97.5%, a difference of 0.010%), South American (97.5%, a difference of 0.010%), Immigrants from Senegal (97.5%, a difference of 0.010%), and Immigrants from Middle Africa (97.5%, a difference of 0.010%).
| Demographics | Rating | Rank | 2nd Grade |
| U.S. Virgin Islanders | 1.6 /100 | #237 | Tragic 97.6% |
| Immigrants | Eastern Asia | 1.6 /100 | #238 | Tragic 97.6% |
| Liberians | 1.6 /100 | #239 | Tragic 97.6% |
| Koreans | 1.5 /100 | #240 | Tragic 97.5% |
| Ethiopians | 1.2 /100 | #241 | Tragic 97.5% |
| Immigrants | Indonesia | 1.2 /100 | #242 | Tragic 97.5% |
| Asians | 1.1 /100 | #243 | Tragic 97.5% |
| Immigrants | Iraq | 1.0 /100 | #244 | Tragic 97.5% |
| Immigrants | Eastern Africa | 0.9 /100 | #245 | Tragic 97.5% |
| South Americans | 0.9 /100 | #246 | Tragic 97.5% |
| Immigrants | Senegal | 0.9 /100 | #247 | Tragic 97.5% |
| Immigrants | Middle Africa | 0.9 /100 | #248 | Tragic 97.5% |
| Bolivians | 0.9 /100 | #249 | Tragic 97.5% |
| Peruvians | 0.9 /100 | #250 | Tragic 97.5% |
| Immigrants | Africa | 0.8 /100 | #251 | Tragic 97.5% |