Comanche vs Immigrants from Iraq 2nd Grade
COMPARE
Comanche
Immigrants from Iraq
2nd Grade
2nd Grade Comparison
Comanche
Immigrants from Iraq
97.9%
2ND GRADE
62.8/ 100
METRIC RATING
159th/ 347
METRIC RANK
97.5%
2ND GRADE
1.0/ 100
METRIC RATING
244th/ 347
METRIC RANK
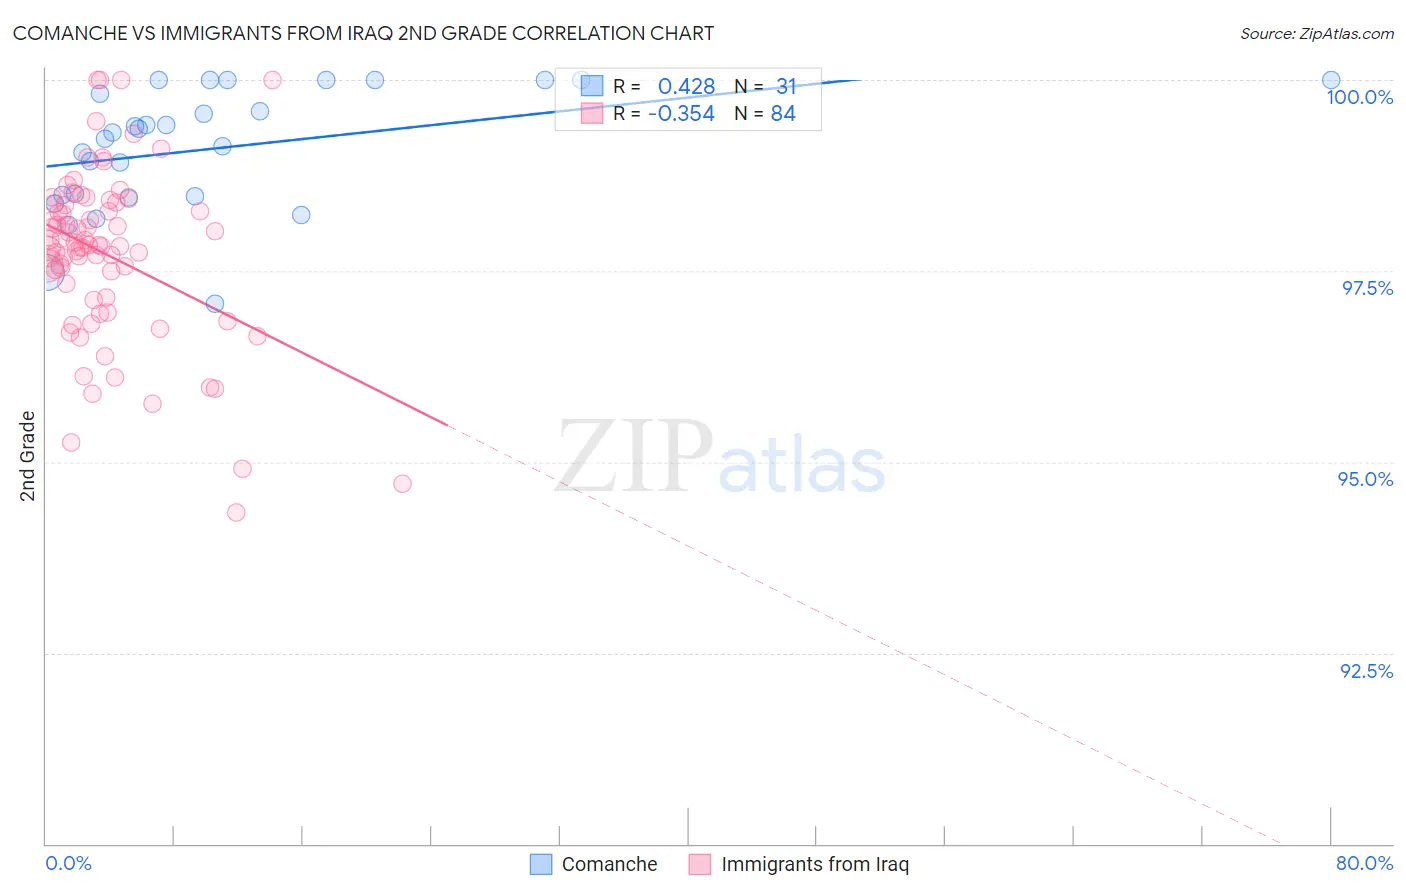
Comanche vs Immigrants from Iraq 2nd Grade Correlation Chart
The statistical analysis conducted on geographies consisting of 109,786,530 people shows a moderate positive correlation between the proportion of Comanche and percentage of population with at least 2nd grade education in the United States with a correlation coefficient (R) of 0.428 and weighted average of 97.9%. Similarly, the statistical analysis conducted on geographies consisting of 194,726,982 people shows a mild negative correlation between the proportion of Immigrants from Iraq and percentage of population with at least 2nd grade education in the United States with a correlation coefficient (R) of -0.354 and weighted average of 97.5%, a difference of 0.40%.
2nd Grade Correlation Summary
| Measurement | Comanche | Immigrants from Iraq |
| Minimum | 97.1% | 94.3% |
| Maximum | 100.0% | 100.0% |
| Range | 2.9% | 5.7% |
| Mean | 99.1% | 97.7% |
| Median | 99.3% | 97.8% |
| Interquartile 25% (IQ1) | 98.5% | 97.1% |
| Interquartile 75% (IQ3) | 100.0% | 98.4% |
| Interquartile Range (IQR) | 1.5% | 1.2% |
| Standard Deviation (Sample) | 0.80% | 1.1% |
| Standard Deviation (Population) | 0.79% | 1.1% |
Similar Demographics by 2nd Grade
Demographics Similar to Comanche by 2nd Grade
In terms of 2nd grade, the demographic groups most similar to Comanche are Dutch West Indian (97.9%, a difference of 0.0%), Venezuelan (97.9%, a difference of 0.0%), Immigrants from Iran (97.9%, a difference of 0.0%), French American Indian (97.9%, a difference of 0.010%), and Immigrants from Eastern Europe (97.9%, a difference of 0.010%).
| Demographics | Rating | Rank | 2nd Grade |
| Immigrants | North Macedonia | 68.5 /100 | #152 | Good 97.9% |
| Immigrants | South Central Asia | 68.3 /100 | #153 | Good 97.9% |
| Marshallese | 67.7 /100 | #154 | Good 97.9% |
| French American Indians | 64.3 /100 | #155 | Good 97.9% |
| Dutch West Indians | 63.8 /100 | #156 | Good 97.9% |
| Venezuelans | 63.3 /100 | #157 | Good 97.9% |
| Immigrants | Iran | 62.8 /100 | #158 | Good 97.9% |
| Comanche | 62.8 /100 | #159 | Good 97.9% |
| Immigrants | Eastern Europe | 61.1 /100 | #160 | Good 97.9% |
| Immigrants | Russia | 60.3 /100 | #161 | Good 97.9% |
| Immigrants | Italy | 60.2 /100 | #162 | Good 97.9% |
| Bermudans | 59.4 /100 | #163 | Average 97.9% |
| Ugandans | 56.6 /100 | #164 | Average 97.9% |
| Spanish Americans | 56.4 /100 | #165 | Average 97.9% |
| Immigrants | Jordan | 56.3 /100 | #166 | Average 97.9% |
Demographics Similar to Immigrants from Iraq by 2nd Grade
In terms of 2nd grade, the demographic groups most similar to Immigrants from Iraq are Asian (97.5%, a difference of 0.010%), Immigrants from Eastern Africa (97.5%, a difference of 0.010%), South American (97.5%, a difference of 0.010%), Immigrants from Senegal (97.5%, a difference of 0.010%), and Immigrants from Middle Africa (97.5%, a difference of 0.010%).
| Demographics | Rating | Rank | 2nd Grade |
| U.S. Virgin Islanders | 1.6 /100 | #237 | Tragic 97.6% |
| Immigrants | Eastern Asia | 1.6 /100 | #238 | Tragic 97.6% |
| Liberians | 1.6 /100 | #239 | Tragic 97.6% |
| Koreans | 1.5 /100 | #240 | Tragic 97.5% |
| Ethiopians | 1.2 /100 | #241 | Tragic 97.5% |
| Immigrants | Indonesia | 1.2 /100 | #242 | Tragic 97.5% |
| Asians | 1.1 /100 | #243 | Tragic 97.5% |
| Immigrants | Iraq | 1.0 /100 | #244 | Tragic 97.5% |
| Immigrants | Eastern Africa | 0.9 /100 | #245 | Tragic 97.5% |
| South Americans | 0.9 /100 | #246 | Tragic 97.5% |
| Immigrants | Senegal | 0.9 /100 | #247 | Tragic 97.5% |
| Immigrants | Middle Africa | 0.9 /100 | #248 | Tragic 97.5% |
| Bolivians | 0.9 /100 | #249 | Tragic 97.5% |
| Peruvians | 0.9 /100 | #250 | Tragic 97.5% |
| Immigrants | Africa | 0.8 /100 | #251 | Tragic 97.5% |