Irish vs Celtic 2nd Grade
COMPARE
Irish
Celtic
2nd Grade
2nd Grade Comparison
Irish
Celtics
98.6%
2ND GRADE
100.0/ 100
METRIC RATING
18th/ 347
METRIC RANK
98.4%
2ND GRADE
99.8/ 100
METRIC RATING
49th/ 347
METRIC RANK
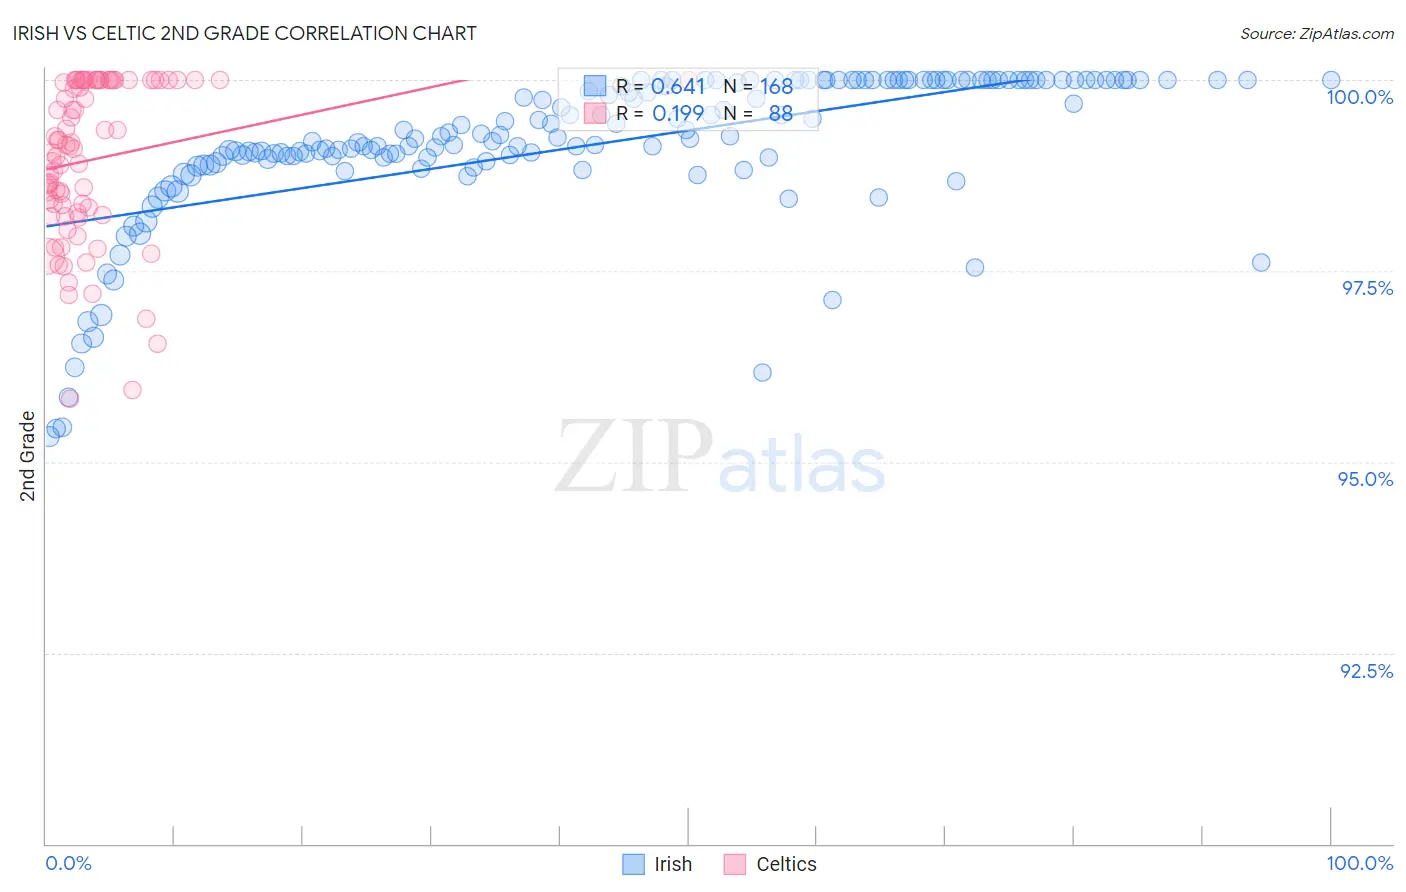
Irish vs Celtic 2nd Grade Correlation Chart
The statistical analysis conducted on geographies consisting of 580,708,963 people shows a significant positive correlation between the proportion of Irish and percentage of population with at least 2nd grade education in the United States with a correlation coefficient (R) of 0.641 and weighted average of 98.6%. Similarly, the statistical analysis conducted on geographies consisting of 168,875,705 people shows a poor positive correlation between the proportion of Celtics and percentage of population with at least 2nd grade education in the United States with a correlation coefficient (R) of 0.199 and weighted average of 98.4%, a difference of 0.20%.
2nd Grade Correlation Summary
| Measurement | Irish | Celtic |
| Minimum | 95.3% | 95.8% |
| Maximum | 100.0% | 100.0% |
| Range | 4.7% | 4.2% |
| Mean | 99.2% | 99.0% |
| Median | 99.3% | 99.1% |
| Interquartile 25% (IQ1) | 98.9% | 98.3% |
| Interquartile 75% (IQ3) | 100.0% | 100.0% |
| Interquartile Range (IQR) | 1.1% | 1.7% |
| Standard Deviation (Sample) | 1.00% | 1.0% |
| Standard Deviation (Population) | 0.99% | 1.0% |
Similar Demographics by 2nd Grade
Demographics Similar to Irish by 2nd Grade
In terms of 2nd grade, the demographic groups most similar to Irish are Aleut (98.6%, a difference of 0.0%), Finnish (98.5%, a difference of 0.010%), Sioux (98.5%, a difference of 0.010%), Lithuanian (98.5%, a difference of 0.010%), and Polish (98.5%, a difference of 0.010%).
| Demographics | Rating | Rank | 2nd Grade |
| Tlingit-Haida | 100.0 /100 | #11 | Exceptional 98.6% |
| Carpatho Rusyns | 100.0 /100 | #12 | Exceptional 98.6% |
| English | 100.0 /100 | #13 | Exceptional 98.6% |
| Swedes | 100.0 /100 | #14 | Exceptional 98.6% |
| Scottish | 100.0 /100 | #15 | Exceptional 98.6% |
| Dutch | 100.0 /100 | #16 | Exceptional 98.6% |
| Aleuts | 100.0 /100 | #17 | Exceptional 98.6% |
| Irish | 100.0 /100 | #18 | Exceptional 98.6% |
| Finns | 100.0 /100 | #19 | Exceptional 98.5% |
| Sioux | 100.0 /100 | #20 | Exceptional 98.5% |
| Lithuanians | 100.0 /100 | #21 | Exceptional 98.5% |
| Poles | 100.0 /100 | #22 | Exceptional 98.5% |
| Danes | 100.0 /100 | #23 | Exceptional 98.5% |
| Pennsylvania Germans | 100.0 /100 | #24 | Exceptional 98.5% |
| Scotch-Irish | 100.0 /100 | #25 | Exceptional 98.5% |
Demographics Similar to Celtics by 2nd Grade
In terms of 2nd grade, the demographic groups most similar to Celtics are White/Caucasian (98.4%, a difference of 0.0%), Estonian (98.4%, a difference of 0.0%), Australian (98.4%, a difference of 0.0%), Czechoslovakian (98.4%, a difference of 0.010%), and Pueblo (98.3%, a difference of 0.010%).
| Demographics | Rating | Rank | 2nd Grade |
| Native Hawaiians | 99.9 /100 | #42 | Exceptional 98.4% |
| Belgians | 99.9 /100 | #43 | Exceptional 98.4% |
| Northern Europeans | 99.9 /100 | #44 | Exceptional 98.4% |
| Hungarians | 99.9 /100 | #45 | Exceptional 98.4% |
| Lumbee | 99.9 /100 | #46 | Exceptional 98.4% |
| Ottawa | 99.9 /100 | #47 | Exceptional 98.4% |
| Czechoslovakians | 99.9 /100 | #48 | Exceptional 98.4% |
| Celtics | 99.8 /100 | #49 | Exceptional 98.4% |
| Whites/Caucasians | 99.8 /100 | #50 | Exceptional 98.4% |
| Estonians | 99.8 /100 | #51 | Exceptional 98.4% |
| Australians | 99.8 /100 | #52 | Exceptional 98.4% |
| Pueblo | 99.8 /100 | #53 | Exceptional 98.3% |
| Kiowa | 99.8 /100 | #54 | Exceptional 98.3% |
| Immigrants | Scotland | 99.8 /100 | #55 | Exceptional 98.3% |
| Americans | 99.8 /100 | #56 | Exceptional 98.3% |