Immigrants from Philippines vs Immigrants from Iraq 2nd Grade
COMPARE
Immigrants from Philippines
Immigrants from Iraq
2nd Grade
2nd Grade Comparison
Immigrants from Philippines
Immigrants from Iraq
97.3%
2ND GRADE
0.1/ 100
METRIC RATING
276th/ 347
METRIC RANK
97.5%
2ND GRADE
1.0/ 100
METRIC RATING
244th/ 347
METRIC RANK
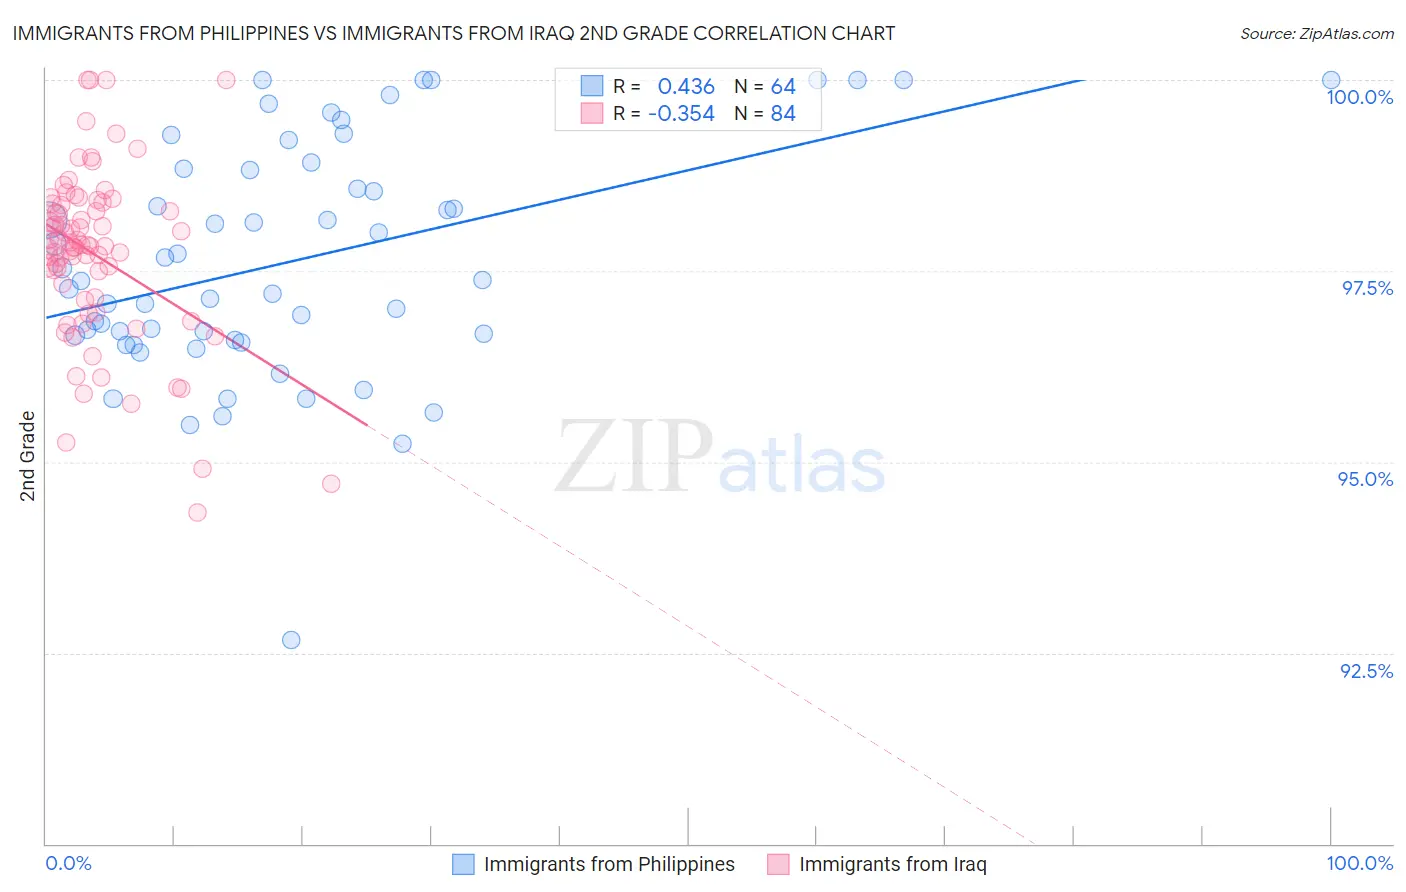
Immigrants from Philippines vs Immigrants from Iraq 2nd Grade Correlation Chart
The statistical analysis conducted on geographies consisting of 471,303,140 people shows a moderate positive correlation between the proportion of Immigrants from Philippines and percentage of population with at least 2nd grade education in the United States with a correlation coefficient (R) of 0.436 and weighted average of 97.3%. Similarly, the statistical analysis conducted on geographies consisting of 194,726,982 people shows a mild negative correlation between the proportion of Immigrants from Iraq and percentage of population with at least 2nd grade education in the United States with a correlation coefficient (R) of -0.354 and weighted average of 97.5%, a difference of 0.20%.
2nd Grade Correlation Summary
| Measurement | Immigrants from Philippines | Immigrants from Iraq |
| Minimum | 92.7% | 94.3% |
| Maximum | 100.0% | 100.0% |
| Range | 7.3% | 5.7% |
| Mean | 97.6% | 97.7% |
| Median | 97.4% | 97.8% |
| Interquartile 25% (IQ1) | 96.6% | 97.1% |
| Interquartile 75% (IQ3) | 98.8% | 98.4% |
| Interquartile Range (IQR) | 2.2% | 1.2% |
| Standard Deviation (Sample) | 1.5% | 1.1% |
| Standard Deviation (Population) | 1.5% | 1.1% |
Similar Demographics by 2nd Grade
Demographics Similar to Immigrants from Philippines by 2nd Grade
In terms of 2nd grade, the demographic groups most similar to Immigrants from Philippines are Immigrants from Western Africa (97.3%, a difference of 0.0%), Immigrants from Uzbekistan (97.3%, a difference of 0.010%), Immigrants from Ghana (97.3%, a difference of 0.020%), Ghanaian (97.4%, a difference of 0.030%), and Immigrants from China (97.3%, a difference of 0.030%).
| Demographics | Rating | Rank | 2nd Grade |
| West Indians | 0.3 /100 | #269 | Tragic 97.4% |
| Immigrants | Jamaica | 0.2 /100 | #270 | Tragic 97.4% |
| Immigrants | Cameroon | 0.2 /100 | #271 | Tragic 97.4% |
| Immigrants | Peru | 0.1 /100 | #272 | Tragic 97.4% |
| Immigrants | Bolivia | 0.1 /100 | #273 | Tragic 97.4% |
| Ghanaians | 0.1 /100 | #274 | Tragic 97.4% |
| Immigrants | China | 0.1 /100 | #275 | Tragic 97.3% |
| Immigrants | Philippines | 0.1 /100 | #276 | Tragic 97.3% |
| Immigrants | Western Africa | 0.1 /100 | #277 | Tragic 97.3% |
| Immigrants | Uzbekistan | 0.1 /100 | #278 | Tragic 97.3% |
| Immigrants | Ghana | 0.1 /100 | #279 | Tragic 97.3% |
| Afghans | 0.1 /100 | #280 | Tragic 97.3% |
| Trinidadians and Tobagonians | 0.1 /100 | #281 | Tragic 97.3% |
| Barbadians | 0.1 /100 | #282 | Tragic 97.3% |
| Immigrants | Trinidad and Tobago | 0.0 /100 | #283 | Tragic 97.2% |
Demographics Similar to Immigrants from Iraq by 2nd Grade
In terms of 2nd grade, the demographic groups most similar to Immigrants from Iraq are Asian (97.5%, a difference of 0.010%), Immigrants from Eastern Africa (97.5%, a difference of 0.010%), South American (97.5%, a difference of 0.010%), Immigrants from Senegal (97.5%, a difference of 0.010%), and Immigrants from Middle Africa (97.5%, a difference of 0.010%).
| Demographics | Rating | Rank | 2nd Grade |
| U.S. Virgin Islanders | 1.6 /100 | #237 | Tragic 97.6% |
| Immigrants | Eastern Asia | 1.6 /100 | #238 | Tragic 97.6% |
| Liberians | 1.6 /100 | #239 | Tragic 97.6% |
| Koreans | 1.5 /100 | #240 | Tragic 97.5% |
| Ethiopians | 1.2 /100 | #241 | Tragic 97.5% |
| Immigrants | Indonesia | 1.2 /100 | #242 | Tragic 97.5% |
| Asians | 1.1 /100 | #243 | Tragic 97.5% |
| Immigrants | Iraq | 1.0 /100 | #244 | Tragic 97.5% |
| Immigrants | Eastern Africa | 0.9 /100 | #245 | Tragic 97.5% |
| South Americans | 0.9 /100 | #246 | Tragic 97.5% |
| Immigrants | Senegal | 0.9 /100 | #247 | Tragic 97.5% |
| Immigrants | Middle Africa | 0.9 /100 | #248 | Tragic 97.5% |
| Bolivians | 0.9 /100 | #249 | Tragic 97.5% |
| Peruvians | 0.9 /100 | #250 | Tragic 97.5% |
| Immigrants | Africa | 0.8 /100 | #251 | Tragic 97.5% |