Palestinian vs Immigrants from Iraq 11th Grade
COMPARE
Palestinian
Immigrants from Iraq
11th Grade
11th Grade Comparison
Palestinians
Immigrants from Iraq
93.4%
11TH GRADE
97.7/ 100
METRIC RATING
115th/ 347
METRIC RANK
92.6%
11TH GRADE
63.7/ 100
METRIC RATING
165th/ 347
METRIC RANK
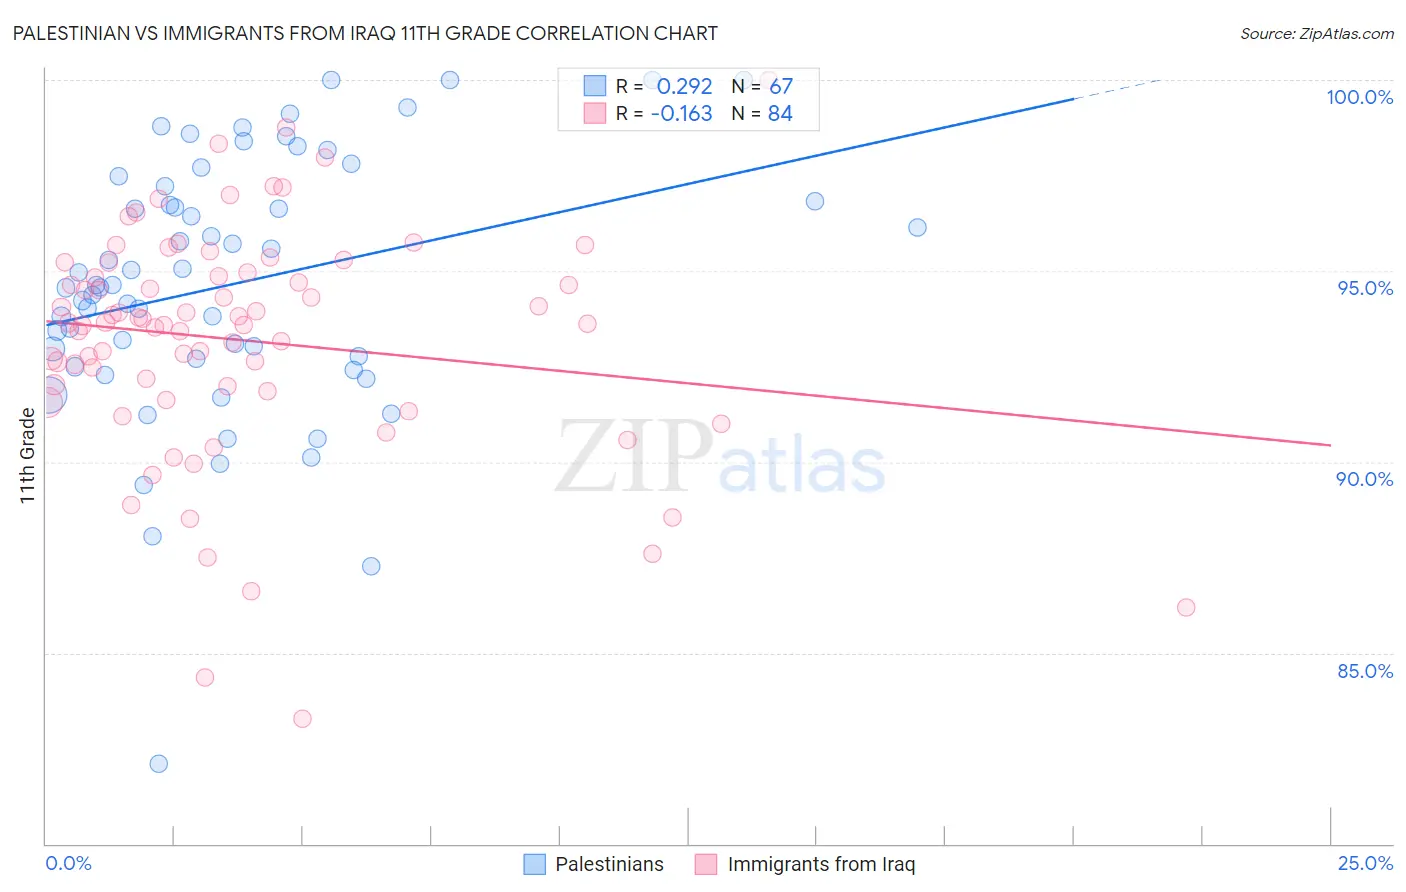
Palestinian vs Immigrants from Iraq 11th Grade Correlation Chart
The statistical analysis conducted on geographies consisting of 216,461,770 people shows a weak positive correlation between the proportion of Palestinians and percentage of population with at least 11th grade education in the United States with a correlation coefficient (R) of 0.292 and weighted average of 93.4%. Similarly, the statistical analysis conducted on geographies consisting of 194,685,376 people shows a poor negative correlation between the proportion of Immigrants from Iraq and percentage of population with at least 11th grade education in the United States with a correlation coefficient (R) of -0.163 and weighted average of 92.6%, a difference of 0.78%.
11th Grade Correlation Summary
| Measurement | Palestinian | Immigrants from Iraq |
| Minimum | 82.1% | 83.3% |
| Maximum | 100.0% | 100.0% |
| Range | 17.9% | 16.7% |
| Mean | 94.7% | 93.2% |
| Median | 94.6% | 93.6% |
| Interquartile 25% (IQ1) | 92.7% | 91.9% |
| Interquartile 75% (IQ3) | 97.2% | 94.9% |
| Interquartile Range (IQR) | 4.5% | 3.0% |
| Standard Deviation (Sample) | 3.4% | 3.0% |
| Standard Deviation (Population) | 3.4% | 3.0% |
Similar Demographics by 11th Grade
Demographics Similar to Palestinians by 11th Grade
In terms of 11th grade, the demographic groups most similar to Palestinians are Jordanian (93.4%, a difference of 0.010%), Immigrants from Zimbabwe (93.4%, a difference of 0.020%), Immigrants from Hungary (93.4%, a difference of 0.020%), White/Caucasian (93.3%, a difference of 0.030%), and Immigrants from Germany (93.4%, a difference of 0.040%).
| Demographics | Rating | Rank | 11th Grade |
| Alaska Natives | 98.4 /100 | #108 | Exceptional 93.5% |
| Immigrants | Kuwait | 98.4 /100 | #109 | Exceptional 93.5% |
| Syrians | 98.4 /100 | #110 | Exceptional 93.4% |
| Yugoslavians | 98.1 /100 | #111 | Exceptional 93.4% |
| Immigrants | Germany | 98.0 /100 | #112 | Exceptional 93.4% |
| Immigrants | Zimbabwe | 97.8 /100 | #113 | Exceptional 93.4% |
| Jordanians | 97.8 /100 | #114 | Exceptional 93.4% |
| Palestinians | 97.7 /100 | #115 | Exceptional 93.4% |
| Immigrants | Hungary | 97.5 /100 | #116 | Exceptional 93.4% |
| Whites/Caucasians | 97.4 /100 | #117 | Exceptional 93.3% |
| Immigrants | Korea | 97.0 /100 | #118 | Exceptional 93.3% |
| Israelis | 97.0 /100 | #119 | Exceptional 93.3% |
| Immigrants | Russia | 96.6 /100 | #120 | Exceptional 93.3% |
| German Russians | 96.4 /100 | #121 | Exceptional 93.3% |
| Immigrants | Belarus | 96.3 /100 | #122 | Exceptional 93.3% |
Demographics Similar to Immigrants from Iraq by 11th Grade
In terms of 11th grade, the demographic groups most similar to Immigrants from Iraq are Bermudan (92.6%, a difference of 0.010%), Nonimmigrants (92.7%, a difference of 0.030%), Spanish (92.7%, a difference of 0.030%), Alsatian (92.6%, a difference of 0.040%), and Paraguayan (92.7%, a difference of 0.050%).
| Demographics | Rating | Rank | 11th Grade |
| Immigrants | Venezuela | 72.0 /100 | #158 | Good 92.7% |
| Americans | 71.7 /100 | #159 | Good 92.7% |
| Immigrants | Lebanon | 70.7 /100 | #160 | Good 92.7% |
| Immigrants | Argentina | 69.8 /100 | #161 | Good 92.7% |
| Paraguayans | 68.7 /100 | #162 | Good 92.7% |
| Immigrants | Nonimmigrants | 66.6 /100 | #163 | Good 92.7% |
| Spanish | 66.2 /100 | #164 | Good 92.7% |
| Immigrants | Iraq | 63.7 /100 | #165 | Good 92.6% |
| Bermudans | 62.3 /100 | #166 | Good 92.6% |
| Alsatians | 60.2 /100 | #167 | Good 92.6% |
| Sierra Leoneans | 58.7 /100 | #168 | Average 92.6% |
| Immigrants | Albania | 57.8 /100 | #169 | Average 92.6% |
| Immigrants | Northern Africa | 57.3 /100 | #170 | Average 92.6% |
| Laotians | 54.4 /100 | #171 | Average 92.6% |
| Immigrants | Pakistan | 52.3 /100 | #172 | Average 92.5% |