Irish vs Immigrants from Latin America Bachelor's Degree
COMPARE
Irish
Immigrants from Latin America
Bachelor's Degree
Bachelor's Degree Comparison
Irish
Immigrants from Latin America
37.6%
BACHELOR'S DEGREE
44.3/ 100
METRIC RATING
180th/ 347
METRIC RANK
30.1%
BACHELOR'S DEGREE
0.0/ 100
METRIC RATING
305th/ 347
METRIC RANK
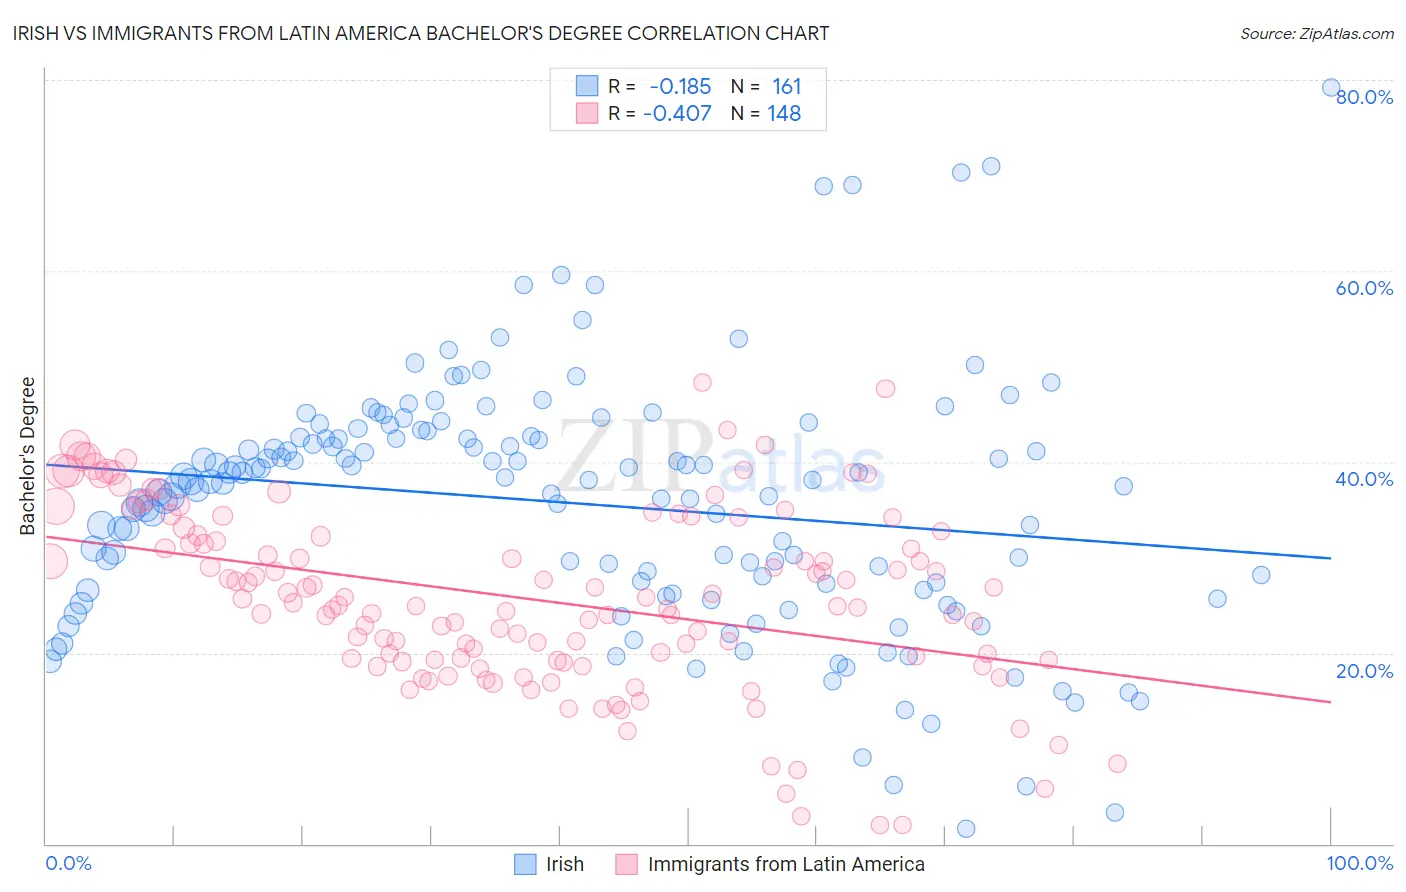
Irish vs Immigrants from Latin America Bachelor's Degree Correlation Chart
The statistical analysis conducted on geographies consisting of 580,386,909 people shows a poor negative correlation between the proportion of Irish and percentage of population with at least bachelor's degree education in the United States with a correlation coefficient (R) of -0.185 and weighted average of 37.6%. Similarly, the statistical analysis conducted on geographies consisting of 558,460,084 people shows a moderate negative correlation between the proportion of Immigrants from Latin America and percentage of population with at least bachelor's degree education in the United States with a correlation coefficient (R) of -0.407 and weighted average of 30.1%, a difference of 25.1%.
Bachelor's Degree Correlation Summary
| Measurement | Irish | Immigrants from Latin America |
| Minimum | 1.6% | 1.9% |
| Maximum | 79.2% | 48.3% |
| Range | 77.6% | 46.4% |
| Mean | 35.7% | 25.7% |
| Median | 37.9% | 25.1% |
| Interquartile 25% (IQ1) | 26.6% | 19.3% |
| Interquartile 75% (IQ3) | 42.6% | 32.5% |
| Interquartile Range (IQR) | 16.1% | 13.2% |
| Standard Deviation (Sample) | 13.0% | 9.4% |
| Standard Deviation (Population) | 13.0% | 9.4% |
Similar Demographics by Bachelor's Degree
Demographics Similar to Irish by Bachelor's Degree
In terms of bachelor's degree, the demographic groups most similar to Irish are Immigrants from Senegal (37.6%, a difference of 0.050%), Immigrants from Bosnia and Herzegovina (37.6%, a difference of 0.090%), Immigrants from Colombia (37.7%, a difference of 0.11%), Senegalese (37.5%, a difference of 0.21%), and Immigrants from Cameroon (37.7%, a difference of 0.24%).
| Demographics | Rating | Rank | Bachelor's Degree |
| Immigrants | Iraq | 52.5 /100 | #173 | Average 37.9% |
| Immigrants | Bangladesh | 50.0 /100 | #174 | Average 37.8% |
| Immigrants | Uruguay | 48.3 /100 | #175 | Average 37.8% |
| Costa Ricans | 47.6 /100 | #176 | Average 37.7% |
| Basques | 47.4 /100 | #177 | Average 37.7% |
| Immigrants | Cameroon | 46.8 /100 | #178 | Average 37.7% |
| Immigrants | Colombia | 45.4 /100 | #179 | Average 37.7% |
| Irish | 44.3 /100 | #180 | Average 37.6% |
| Immigrants | Senegal | 43.8 /100 | #181 | Average 37.6% |
| Immigrants | Bosnia and Herzegovina | 43.4 /100 | #182 | Average 37.6% |
| Senegalese | 42.2 /100 | #183 | Average 37.5% |
| Scandinavians | 41.7 /100 | #184 | Average 37.5% |
| Immigrants | Peru | 41.3 /100 | #185 | Average 37.5% |
| Norwegians | 40.4 /100 | #186 | Average 37.5% |
| English | 39.7 /100 | #187 | Fair 37.4% |
Demographics Similar to Immigrants from Latin America by Bachelor's Degree
In terms of bachelor's degree, the demographic groups most similar to Immigrants from Latin America are Cherokee (30.2%, a difference of 0.42%), Bangladeshi (30.2%, a difference of 0.43%), Immigrants from Yemen (29.9%, a difference of 0.55%), Nepalese (29.9%, a difference of 0.58%), and Mexican American Indian (30.2%, a difference of 0.60%).
| Demographics | Rating | Rank | Bachelor's Degree |
| Chippewa | 0.0 /100 | #298 | Tragic 30.6% |
| Chickasaw | 0.0 /100 | #299 | Tragic 30.4% |
| Immigrants | Micronesia | 0.0 /100 | #300 | Tragic 30.4% |
| Immigrants | Cuba | 0.0 /100 | #301 | Tragic 30.3% |
| Mexican American Indians | 0.0 /100 | #302 | Tragic 30.2% |
| Bangladeshis | 0.0 /100 | #303 | Tragic 30.2% |
| Cherokee | 0.0 /100 | #304 | Tragic 30.2% |
| Immigrants | Latin America | 0.0 /100 | #305 | Tragic 30.1% |
| Immigrants | Yemen | 0.0 /100 | #306 | Tragic 29.9% |
| Nepalese | 0.0 /100 | #307 | Tragic 29.9% |
| Cajuns | 0.0 /100 | #308 | Tragic 29.6% |
| Hispanics or Latinos | 0.0 /100 | #309 | Tragic 29.6% |
| Cheyenne | 0.0 /100 | #310 | Tragic 29.4% |
| Choctaw | 0.0 /100 | #311 | Tragic 29.4% |
| Seminole | 0.0 /100 | #312 | Tragic 29.4% |