Iranian vs South African 3rd Grade
COMPARE
Iranian
South African
3rd Grade
3rd Grade Comparison
Iranians
South Africans
98.0%
3RD GRADE
94.9/ 100
METRIC RATING
118th/ 347
METRIC RANK
98.1%
3RD GRADE
98.2/ 100
METRIC RATING
97th/ 347
METRIC RANK
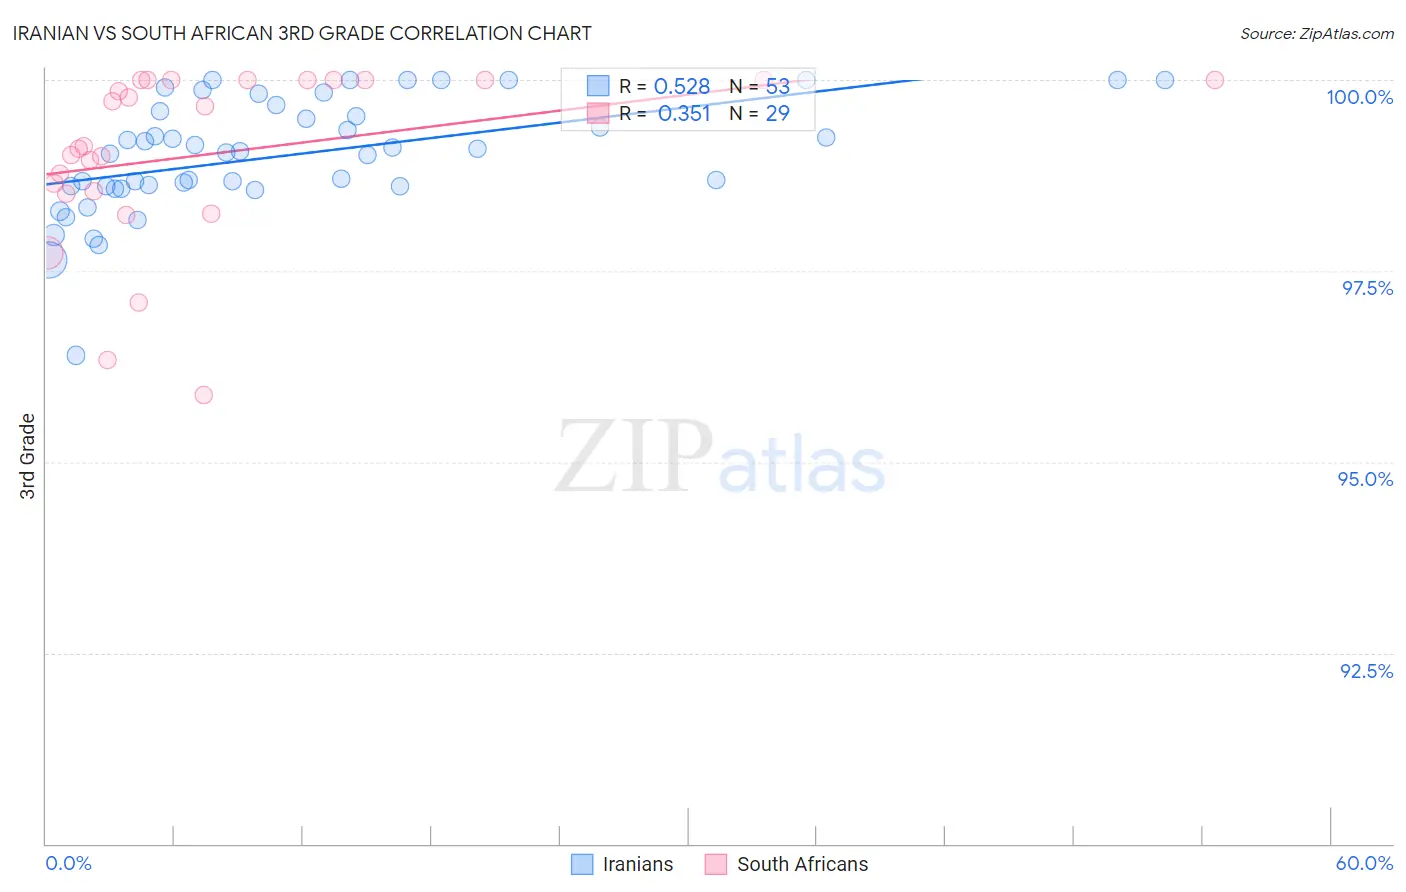
Iranian vs South African 3rd Grade Correlation Chart
The statistical analysis conducted on geographies consisting of 316,902,340 people shows a substantial positive correlation between the proportion of Iranians and percentage of population with at least 3rd grade education in the United States with a correlation coefficient (R) of 0.528 and weighted average of 98.0%. Similarly, the statistical analysis conducted on geographies consisting of 182,604,532 people shows a mild positive correlation between the proportion of South Africans and percentage of population with at least 3rd grade education in the United States with a correlation coefficient (R) of 0.351 and weighted average of 98.1%, a difference of 0.090%.
3rd Grade Correlation Summary
| Measurement | Iranian | South African |
| Minimum | 96.4% | 95.9% |
| Maximum | 100.0% | 100.0% |
| Range | 3.6% | 4.1% |
| Mean | 99.0% | 99.0% |
| Median | 99.1% | 99.1% |
| Interquartile 25% (IQ1) | 98.6% | 98.5% |
| Interquartile 75% (IQ3) | 99.6% | 100.0% |
| Interquartile Range (IQR) | 1.0% | 1.5% |
| Standard Deviation (Sample) | 0.75% | 1.1% |
| Standard Deviation (Population) | 0.74% | 1.1% |
Similar Demographics by 3rd Grade
Demographics Similar to Iranians by 3rd Grade
In terms of 3rd grade, the demographic groups most similar to Iranians are Immigrants from Norway (98.0%, a difference of 0.0%), Immigrants from France (98.0%, a difference of 0.0%), Spanish (98.0%, a difference of 0.0%), Thai (98.0%, a difference of 0.010%), and Menominee (98.0%, a difference of 0.010%).
| Demographics | Rating | Rank | 3rd Grade |
| Basques | 96.5 /100 | #111 | Exceptional 98.0% |
| Immigrants | Latvia | 96.0 /100 | #112 | Exceptional 98.0% |
| Thais | 95.5 /100 | #113 | Exceptional 98.0% |
| Menominee | 95.4 /100 | #114 | Exceptional 98.0% |
| Okinawans | 95.2 /100 | #115 | Exceptional 98.0% |
| Immigrants | Norway | 95.2 /100 | #116 | Exceptional 98.0% |
| Immigrants | France | 95.1 /100 | #117 | Exceptional 98.0% |
| Iranians | 94.9 /100 | #118 | Exceptional 98.0% |
| Spanish | 94.8 /100 | #119 | Exceptional 98.0% |
| Immigrants | Croatia | 94.4 /100 | #120 | Exceptional 98.0% |
| Iroquois | 94.1 /100 | #121 | Exceptional 98.0% |
| Lebanese | 94.1 /100 | #122 | Exceptional 98.0% |
| Syrians | 93.8 /100 | #123 | Exceptional 98.0% |
| Immigrants | Japan | 93.7 /100 | #124 | Exceptional 98.0% |
| Immigrants | Saudi Arabia | 93.5 /100 | #125 | Exceptional 98.0% |
Demographics Similar to South Africans by 3rd Grade
In terms of 3rd grade, the demographic groups most similar to South Africans are Immigrants from Ireland (98.1%, a difference of 0.0%), Immigrants from Germany (98.1%, a difference of 0.010%), Cypriot (98.1%, a difference of 0.010%), Choctaw (98.1%, a difference of 0.010%), and Romanian (98.1%, a difference of 0.010%).
| Demographics | Rating | Rank | 3rd Grade |
| Zimbabweans | 98.8 /100 | #90 | Exceptional 98.1% |
| Hopi | 98.7 /100 | #91 | Exceptional 98.1% |
| Immigrants | South Africa | 98.7 /100 | #92 | Exceptional 98.1% |
| Immigrants | Western Europe | 98.7 /100 | #93 | Exceptional 98.1% |
| Immigrants | Germany | 98.4 /100 | #94 | Exceptional 98.1% |
| Cypriots | 98.4 /100 | #95 | Exceptional 98.1% |
| Immigrants | Ireland | 98.2 /100 | #96 | Exceptional 98.1% |
| South Africans | 98.2 /100 | #97 | Exceptional 98.1% |
| Choctaw | 98.0 /100 | #98 | Exceptional 98.1% |
| Romanians | 98.0 /100 | #99 | Exceptional 98.1% |
| Cree | 97.9 /100 | #100 | Exceptional 98.1% |
| Puget Sound Salish | 97.9 /100 | #101 | Exceptional 98.1% |
| Immigrants | Nonimmigrants | 97.8 /100 | #102 | Exceptional 98.1% |
| Yugoslavians | 97.7 /100 | #103 | Exceptional 98.1% |
| Turks | 97.6 /100 | #104 | Exceptional 98.1% |