Iranian vs Immigrants from Sweden Professional Degree
COMPARE
Iranian
Immigrants from Sweden
Professional Degree
Professional Degree Comparison
Iranians
Immigrants from Sweden
7.6%
PROFESSIONAL DEGREE
100.0/ 100
METRIC RATING
3rd/ 347
METRIC RANK
6.7%
PROFESSIONAL DEGREE
100.0/ 100
METRIC RATING
16th/ 347
METRIC RANK
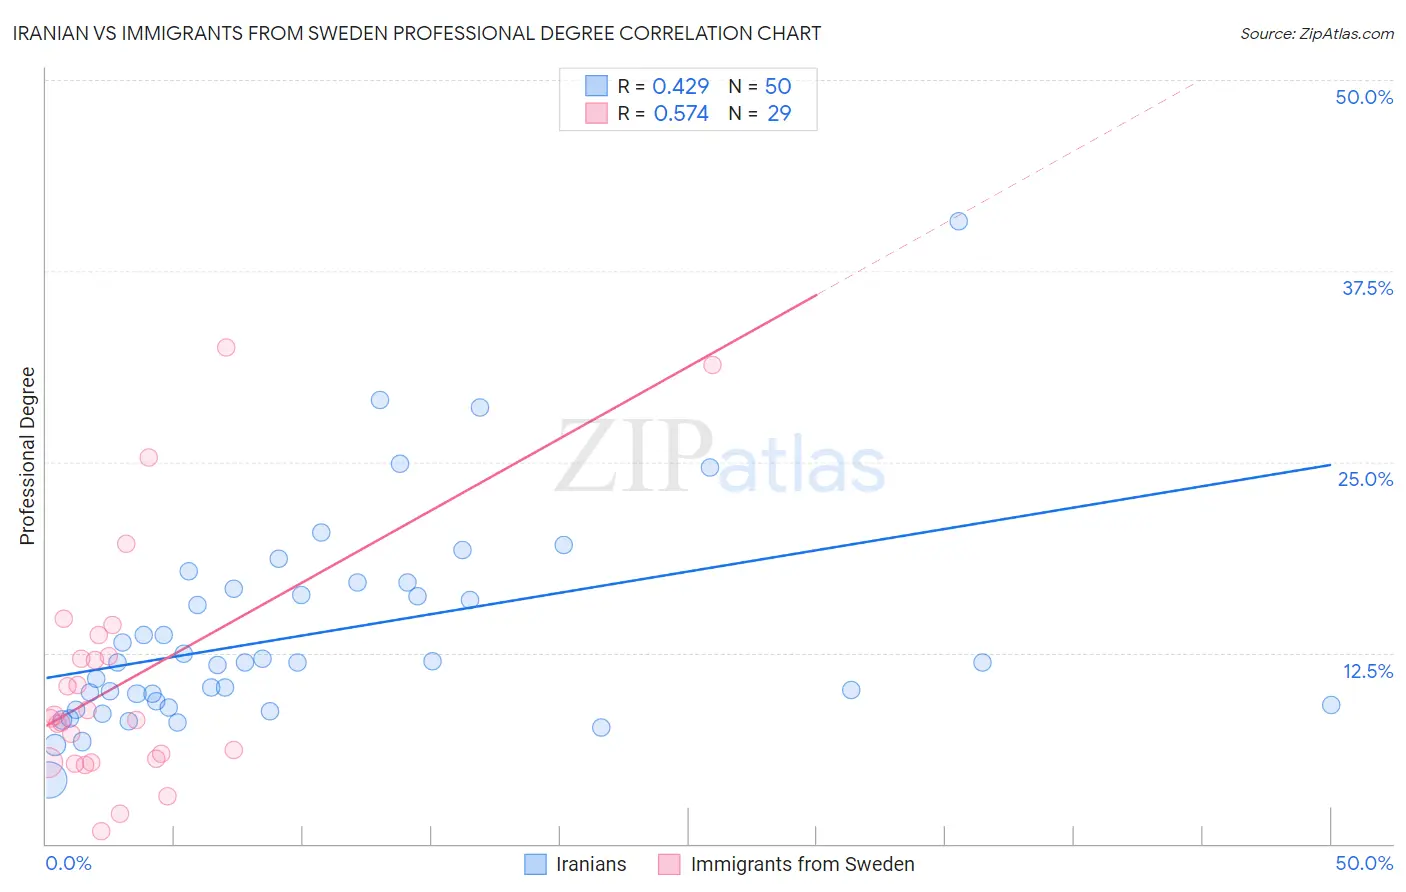
Iranian vs Immigrants from Sweden Professional Degree Correlation Chart
The statistical analysis conducted on geographies consisting of 316,586,125 people shows a moderate positive correlation between the proportion of Iranians and percentage of population with at least professional degree education in the United States with a correlation coefficient (R) of 0.429 and weighted average of 7.6%. Similarly, the statistical analysis conducted on geographies consisting of 164,659,960 people shows a substantial positive correlation between the proportion of Immigrants from Sweden and percentage of population with at least professional degree education in the United States with a correlation coefficient (R) of 0.574 and weighted average of 6.7%, a difference of 13.8%.
Professional Degree Correlation Summary
| Measurement | Iranian | Immigrants from Sweden |
| Minimum | 4.2% | 0.79% |
| Maximum | 40.7% | 32.5% |
| Range | 36.6% | 31.7% |
| Mean | 13.7% | 10.7% |
| Median | 11.9% | 8.2% |
| Interquartile 25% (IQ1) | 9.1% | 5.5% |
| Interquartile 75% (IQ3) | 16.7% | 13.0% |
| Interquartile Range (IQR) | 7.6% | 7.5% |
| Standard Deviation (Sample) | 6.8% | 7.8% |
| Standard Deviation (Population) | 6.7% | 7.7% |
Demographics Similar to Iranians and Immigrants from Sweden by Professional Degree
In terms of professional degree, the demographic groups most similar to Iranians are Filipino (7.6%, a difference of 0.77%), Immigrants from Singapore (7.7%, a difference of 1.6%), Immigrants from Israel (7.9%, a difference of 3.1%), Immigrants from Iran (7.3%, a difference of 4.0%), and Okinawan (7.3%, a difference of 4.2%). Similarly, the demographic groups most similar to Immigrants from Sweden are Immigrants from China (6.7%, a difference of 0.45%), Immigrants from France (6.8%, a difference of 1.5%), Immigrants from Eastern Asia (6.6%, a difference of 2.0%), Soviet Union (6.6%, a difference of 2.0%), and Indian (Asian) (6.5%, a difference of 2.7%).
| Demographics | Rating | Rank | Professional Degree |
| Immigrants | Israel | 100.0 /100 | #1 | Exceptional 7.9% |
| Immigrants | Singapore | 100.0 /100 | #2 | Exceptional 7.7% |
| Iranians | 100.0 /100 | #3 | Exceptional 7.6% |
| Filipinos | 100.0 /100 | #4 | Exceptional 7.6% |
| Immigrants | Iran | 100.0 /100 | #5 | Exceptional 7.3% |
| Okinawans | 100.0 /100 | #6 | Exceptional 7.3% |
| Eastern Europeans | 100.0 /100 | #7 | Exceptional 7.1% |
| Immigrants | Switzerland | 100.0 /100 | #8 | Exceptional 7.1% |
| Immigrants | Taiwan | 100.0 /100 | #9 | Exceptional 7.1% |
| Immigrants | Belgium | 100.0 /100 | #10 | Exceptional 7.0% |
| Cypriots | 100.0 /100 | #11 | Exceptional 6.9% |
| Israelis | 100.0 /100 | #12 | Exceptional 6.9% |
| Immigrants | Australia | 100.0 /100 | #13 | Exceptional 6.9% |
| Immigrants | France | 100.0 /100 | #14 | Exceptional 6.8% |
| Immigrants | China | 100.0 /100 | #15 | Exceptional 6.7% |
| Immigrants | Sweden | 100.0 /100 | #16 | Exceptional 6.7% |
| Immigrants | Eastern Asia | 100.0 /100 | #17 | Exceptional 6.6% |
| Soviet Union | 100.0 /100 | #18 | Exceptional 6.6% |
| Indians (Asian) | 100.0 /100 | #19 | Exceptional 6.5% |
| Immigrants | Denmark | 100.0 /100 | #20 | Exceptional 6.4% |