Immigrants from Croatia vs Immigrants from Grenada Associate's Degree
COMPARE
Immigrants from Croatia
Immigrants from Grenada
Associate's Degree
Associate's Degree Comparison
Immigrants from Croatia
Immigrants from Grenada
50.2%
ASSOCIATE'S DEGREE
98.9/ 100
METRIC RATING
86th/ 347
METRIC RANK
42.6%
ASSOCIATE'S DEGREE
1.3/ 100
METRIC RATING
239th/ 347
METRIC RANK
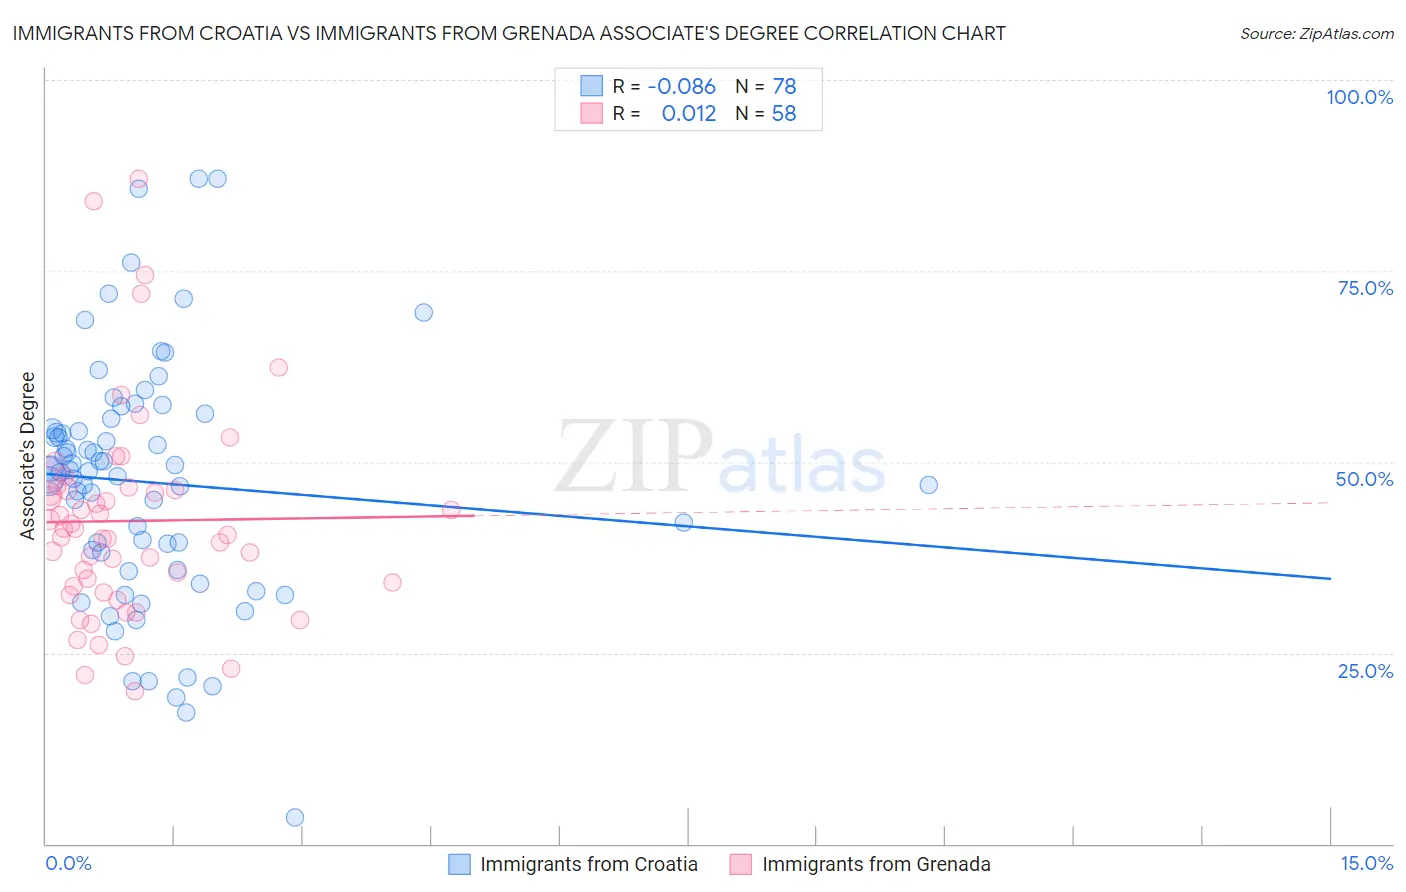
Immigrants from Croatia vs Immigrants from Grenada Associate's Degree Correlation Chart
The statistical analysis conducted on geographies consisting of 132,578,161 people shows a slight negative correlation between the proportion of Immigrants from Croatia and percentage of population with at least associate's degree education in the United States with a correlation coefficient (R) of -0.086 and weighted average of 50.2%. Similarly, the statistical analysis conducted on geographies consisting of 67,201,096 people shows no correlation between the proportion of Immigrants from Grenada and percentage of population with at least associate's degree education in the United States with a correlation coefficient (R) of 0.012 and weighted average of 42.6%, a difference of 17.9%.
Associate's Degree Correlation Summary
| Measurement | Immigrants from Croatia | Immigrants from Grenada |
| Minimum | 3.4% | 20.0% |
| Maximum | 87.1% | 87.1% |
| Range | 83.7% | 67.1% |
| Mean | 47.3% | 42.3% |
| Median | 48.7% | 40.8% |
| Interquartile 25% (IQ1) | 38.1% | 33.8% |
| Interquartile 75% (IQ3) | 54.3% | 46.4% |
| Interquartile Range (IQR) | 16.2% | 12.7% |
| Standard Deviation (Sample) | 15.9% | 13.7% |
| Standard Deviation (Population) | 15.8% | 13.5% |
Similar Demographics by Associate's Degree
Demographics Similar to Immigrants from Croatia by Associate's Degree
In terms of associate's degree, the demographic groups most similar to Immigrants from Croatia are Immigrants from Egypt (50.2%, a difference of 0.010%), Immigrants from Hungary (50.2%, a difference of 0.060%), Immigrants from Uzbekistan (50.3%, a difference of 0.080%), Greek (50.3%, a difference of 0.12%), and Immigrants from Moldova (50.2%, a difference of 0.12%).
| Demographics | Rating | Rank | Associate's Degree |
| Ethiopians | 99.1 /100 | #79 | Exceptional 50.4% |
| Armenians | 99.1 /100 | #80 | Exceptional 50.4% |
| Maltese | 99.1 /100 | #81 | Exceptional 50.4% |
| Greeks | 98.9 /100 | #82 | Exceptional 50.3% |
| Immigrants | Uzbekistan | 98.9 /100 | #83 | Exceptional 50.3% |
| Immigrants | Hungary | 98.9 /100 | #84 | Exceptional 50.2% |
| Immigrants | Egypt | 98.9 /100 | #85 | Exceptional 50.2% |
| Immigrants | Croatia | 98.9 /100 | #86 | Exceptional 50.2% |
| Immigrants | Moldova | 98.8 /100 | #87 | Exceptional 50.2% |
| Immigrants | Canada | 98.7 /100 | #88 | Exceptional 50.1% |
| Immigrants | Western Europe | 98.7 /100 | #89 | Exceptional 50.1% |
| Immigrants | Ethiopia | 98.7 /100 | #90 | Exceptional 50.1% |
| Immigrants | Western Asia | 98.7 /100 | #91 | Exceptional 50.1% |
| Immigrants | North America | 98.7 /100 | #92 | Exceptional 50.1% |
| Immigrants | Brazil | 98.5 /100 | #93 | Exceptional 50.0% |
Demographics Similar to Immigrants from Grenada by Associate's Degree
In terms of associate's degree, the demographic groups most similar to Immigrants from Grenada are Cree (42.5%, a difference of 0.18%), Iroquois (42.8%, a difference of 0.51%), British West Indian (42.4%, a difference of 0.51%), Immigrants from West Indies (42.4%, a difference of 0.52%), and Guyanese (42.3%, a difference of 0.64%).
| Demographics | Rating | Rank | Associate's Degree |
| Native Hawaiians | 2.3 /100 | #232 | Tragic 43.1% |
| Tongans | 2.2 /100 | #233 | Tragic 43.0% |
| Tlingit-Haida | 2.1 /100 | #234 | Tragic 43.0% |
| Ecuadorians | 2.0 /100 | #235 | Tragic 43.0% |
| Immigrants | St. Vincent and the Grenadines | 1.9 /100 | #236 | Tragic 42.9% |
| Immigrants | Nonimmigrants | 1.9 /100 | #237 | Tragic 42.9% |
| Iroquois | 1.7 /100 | #238 | Tragic 42.8% |
| Immigrants | Grenada | 1.3 /100 | #239 | Tragic 42.6% |
| Cree | 1.2 /100 | #240 | Tragic 42.5% |
| British West Indians | 1.0 /100 | #241 | Tragic 42.4% |
| Immigrants | West Indies | 1.0 /100 | #242 | Tragic 42.4% |
| Guyanese | 1.0 /100 | #243 | Tragic 42.3% |
| Immigrants | Liberia | 0.9 /100 | #244 | Tragic 42.3% |
| Immigrants | Cambodia | 0.9 /100 | #245 | Tragic 42.3% |
| Delaware | 0.9 /100 | #246 | Tragic 42.3% |