Dutch vs African College, 1 year or more
COMPARE
Dutch
African
College, 1 year or more
College, 1 year or more Comparison
Dutch
Africans
58.6%
COLLEGE, 1 YEAR OR MORE
26.2/ 100
METRIC RATING
195th/ 347
METRIC RANK
55.0%
COLLEGE, 1 YEAR OR MORE
0.4/ 100
METRIC RATING
258th/ 347
METRIC RANK
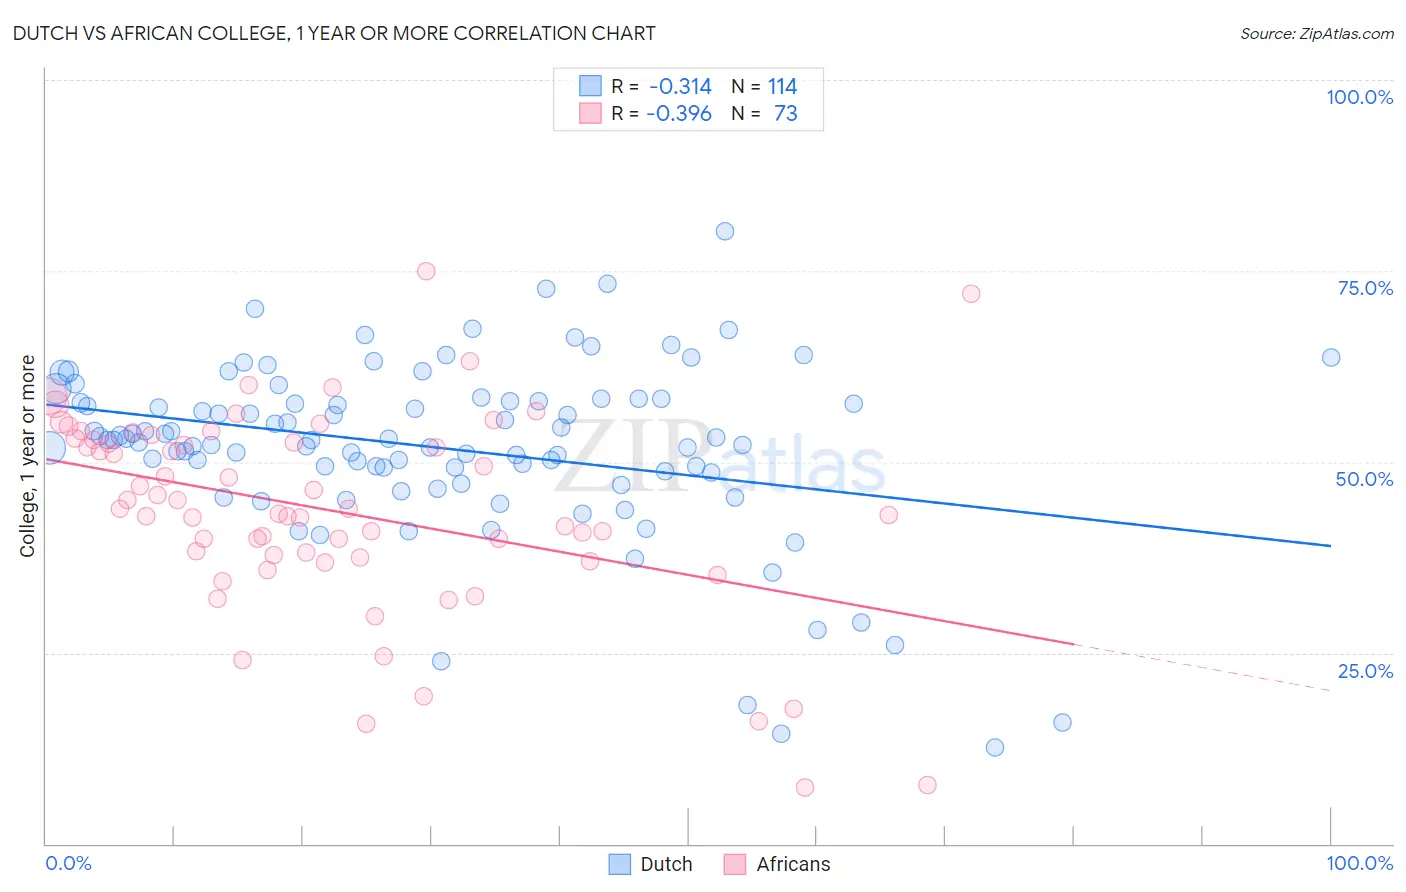
Dutch vs African College, 1 year or more Correlation Chart
The statistical analysis conducted on geographies consisting of 554,349,902 people shows a mild negative correlation between the proportion of Dutch and percentage of population with at least college, 1 year or more education in the United States with a correlation coefficient (R) of -0.314 and weighted average of 58.6%. Similarly, the statistical analysis conducted on geographies consisting of 470,090,594 people shows a mild negative correlation between the proportion of Africans and percentage of population with at least college, 1 year or more education in the United States with a correlation coefficient (R) of -0.396 and weighted average of 55.0%, a difference of 6.6%.
College, 1 year or more Correlation Summary
| Measurement | Dutch | African |
| Minimum | 12.6% | 7.4% |
| Maximum | 80.2% | 75.0% |
| Range | 67.6% | 67.6% |
| Mean | 51.9% | 43.7% |
| Median | 52.9% | 43.8% |
| Interquartile 25% (IQ1) | 48.7% | 37.7% |
| Interquartile 75% (IQ3) | 58.0% | 53.0% |
| Interquartile Range (IQR) | 9.3% | 15.3% |
| Standard Deviation (Sample) | 11.6% | 13.2% |
| Standard Deviation (Population) | 11.5% | 13.1% |
Similar Demographics by College, 1 year or more
Demographics Similar to Dutch by College, 1 year or more
In terms of college, 1 year or more, the demographic groups most similar to Dutch are Guamanian/Chamorro (58.6%, a difference of 0.0%), Immigrants from Thailand (58.6%, a difference of 0.010%), Costa Rican (58.6%, a difference of 0.020%), Immigrants from South Eastern Asia (58.5%, a difference of 0.080%), and Peruvian (58.6%, a difference of 0.090%).
| Demographics | Rating | Rank | College, 1 year or more |
| French | 34.4 /100 | #188 | Fair 58.9% |
| Uruguayans | 31.8 /100 | #189 | Fair 58.8% |
| Immigrants | Cameroon | 31.2 /100 | #190 | Fair 58.8% |
| Immigrants | Philippines | 29.2 /100 | #191 | Fair 58.7% |
| Colombians | 27.6 /100 | #192 | Fair 58.7% |
| Peruvians | 27.5 /100 | #193 | Fair 58.6% |
| Costa Ricans | 26.4 /100 | #194 | Fair 58.6% |
| Dutch | 26.2 /100 | #195 | Fair 58.6% |
| Guamanians/Chamorros | 26.2 /100 | #196 | Fair 58.6% |
| Immigrants | Thailand | 26.0 /100 | #197 | Fair 58.6% |
| Immigrants | South Eastern Asia | 25.1 /100 | #198 | Fair 58.5% |
| Slovaks | 24.6 /100 | #199 | Fair 58.5% |
| Spanish | 24.2 /100 | #200 | Fair 58.5% |
| Nigerians | 23.0 /100 | #201 | Fair 58.5% |
| Immigrants | South America | 21.9 /100 | #202 | Fair 58.4% |
Demographics Similar to Africans by College, 1 year or more
In terms of college, 1 year or more, the demographic groups most similar to Africans are Nepalese (54.9%, a difference of 0.060%), Jamaican (54.9%, a difference of 0.16%), Ottawa (54.9%, a difference of 0.19%), Immigrants from St. Vincent and the Grenadines (54.8%, a difference of 0.27%), and Indonesian (55.1%, a difference of 0.28%).
| Demographics | Rating | Rank | College, 1 year or more |
| Immigrants | Cambodia | 0.6 /100 | #251 | Tragic 55.4% |
| Aleuts | 0.6 /100 | #252 | Tragic 55.4% |
| Immigrants | Barbados | 0.6 /100 | #253 | Tragic 55.4% |
| Japanese | 0.5 /100 | #254 | Tragic 55.2% |
| Immigrants | Bahamas | 0.5 /100 | #255 | Tragic 55.2% |
| Immigrants | West Indies | 0.5 /100 | #256 | Tragic 55.2% |
| Indonesians | 0.4 /100 | #257 | Tragic 55.1% |
| Africans | 0.4 /100 | #258 | Tragic 55.0% |
| Nepalese | 0.3 /100 | #259 | Tragic 54.9% |
| Jamaicans | 0.3 /100 | #260 | Tragic 54.9% |
| Ottawa | 0.3 /100 | #261 | Tragic 54.9% |
| Immigrants | St. Vincent and the Grenadines | 0.3 /100 | #262 | Tragic 54.8% |
| U.S. Virgin Islanders | 0.3 /100 | #263 | Tragic 54.8% |
| Immigrants | Micronesia | 0.3 /100 | #264 | Tragic 54.8% |
| Immigrants | Laos | 0.2 /100 | #265 | Tragic 54.7% |