Inupiat vs Yakama 7th Grade
COMPARE
Inupiat
Yakama
7th Grade
7th Grade Comparison
Inupiat
Yakama
97.4%
7TH GRADE
100.0/ 100
METRIC RATING
21st/ 347
METRIC RANK
91.7%
7TH GRADE
0.0/ 100
METRIC RATING
340th/ 347
METRIC RANK
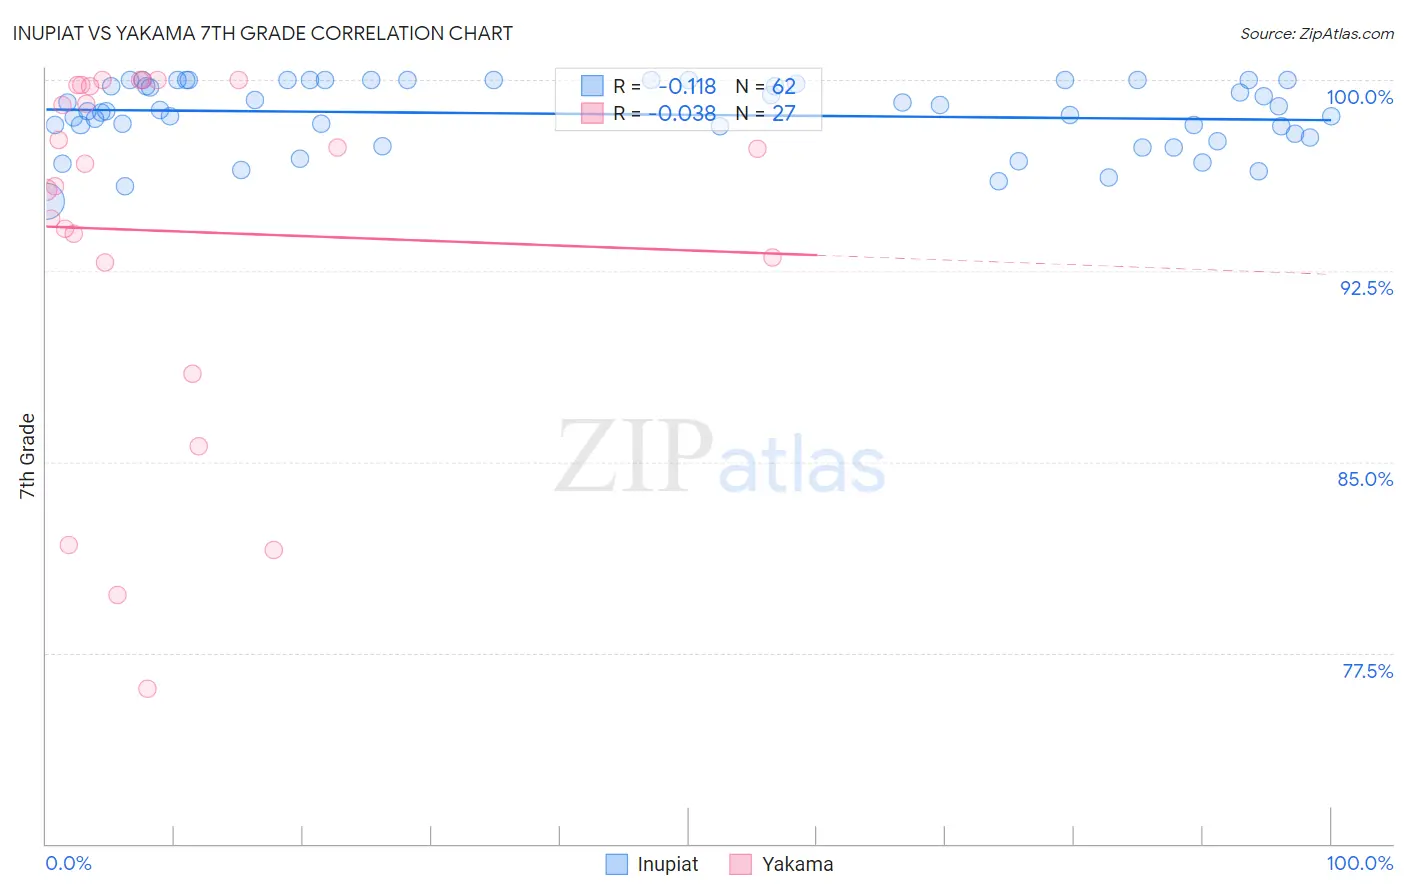
Inupiat vs Yakama 7th Grade Correlation Chart
The statistical analysis conducted on geographies consisting of 96,348,974 people shows a poor negative correlation between the proportion of Inupiat and percentage of population with at least 7th grade education in the United States with a correlation coefficient (R) of -0.118 and weighted average of 97.4%. Similarly, the statistical analysis conducted on geographies consisting of 19,923,144 people shows no correlation between the proportion of Yakama and percentage of population with at least 7th grade education in the United States with a correlation coefficient (R) of -0.038 and weighted average of 91.7%, a difference of 6.2%.
7th Grade Correlation Summary
| Measurement | Inupiat | Yakama |
| Minimum | 95.2% | 76.1% |
| Maximum | 100.0% | 100.0% |
| Range | 4.8% | 23.9% |
| Mean | 98.7% | 94.1% |
| Median | 98.8% | 96.7% |
| Interquartile 25% (IQ1) | 97.9% | 92.8% |
| Interquartile 75% (IQ3) | 100.0% | 99.8% |
| Interquartile Range (IQR) | 2.1% | 6.9% |
| Standard Deviation (Sample) | 1.3% | 7.1% |
| Standard Deviation (Population) | 1.3% | 7.0% |
Similar Demographics by 7th Grade
Demographics Similar to Inupiat by 7th Grade
In terms of 7th grade, the demographic groups most similar to Inupiat are French Canadian (97.4%, a difference of 0.0%), Yup'ik (97.4%, a difference of 0.010%), Croatian (97.4%, a difference of 0.020%), Welsh (97.4%, a difference of 0.030%), and French (97.4%, a difference of 0.040%).
| Demographics | Rating | Rank | 7th Grade |
| Pennsylvania Germans | 100.0 /100 | #14 | Exceptional 97.6% |
| English | 100.0 /100 | #15 | Exceptional 97.6% |
| Irish | 100.0 /100 | #16 | Exceptional 97.5% |
| Scottish | 100.0 /100 | #17 | Exceptional 97.5% |
| Tlingit-Haida | 100.0 /100 | #18 | Exceptional 97.5% |
| Lithuanians | 100.0 /100 | #19 | Exceptional 97.5% |
| Yup'ik | 100.0 /100 | #20 | Exceptional 97.4% |
| Inupiat | 100.0 /100 | #21 | Exceptional 97.4% |
| French Canadians | 100.0 /100 | #22 | Exceptional 97.4% |
| Croatians | 100.0 /100 | #23 | Exceptional 97.4% |
| Welsh | 100.0 /100 | #24 | Exceptional 97.4% |
| French | 100.0 /100 | #25 | Exceptional 97.4% |
| Scotch-Irish | 100.0 /100 | #26 | Exceptional 97.4% |
| Danes | 100.0 /100 | #27 | Exceptional 97.4% |
| Sioux | 100.0 /100 | #28 | Exceptional 97.4% |
Demographics Similar to Yakama by 7th Grade
In terms of 7th grade, the demographic groups most similar to Yakama are Guatemalan (91.7%, a difference of 0.020%), Mexican (91.9%, a difference of 0.20%), Salvadoran (91.5%, a difference of 0.29%), Central American (92.1%, a difference of 0.44%), and Immigrants from Guatemala (91.3%, a difference of 0.45%).
| Demographics | Rating | Rank | 7th Grade |
| Immigrants | Armenia | 0.0 /100 | #333 | Tragic 92.7% |
| Immigrants | Yemen | 0.0 /100 | #334 | Tragic 92.6% |
| Mexican American Indians | 0.0 /100 | #335 | Tragic 92.6% |
| Immigrants | Honduras | 0.0 /100 | #336 | Tragic 92.5% |
| Immigrants | Latin America | 0.0 /100 | #337 | Tragic 92.2% |
| Central Americans | 0.0 /100 | #338 | Tragic 92.1% |
| Mexicans | 0.0 /100 | #339 | Tragic 91.9% |
| Yakama | 0.0 /100 | #340 | Tragic 91.7% |
| Guatemalans | 0.0 /100 | #341 | Tragic 91.7% |
| Salvadorans | 0.0 /100 | #342 | Tragic 91.5% |
| Immigrants | Guatemala | 0.0 /100 | #343 | Tragic 91.3% |
| Immigrants | Central America | 0.0 /100 | #344 | Tragic 91.0% |
| Immigrants | El Salvador | 0.0 /100 | #345 | Tragic 90.9% |
| Immigrants | Mexico | 0.0 /100 | #346 | Tragic 90.7% |
| Spanish American Indians | 0.0 /100 | #347 | Tragic 90.3% |