Immigrants from Korea vs Yakama 7th Grade
COMPARE
Immigrants from Korea
Yakama
7th Grade
7th Grade Comparison
Immigrants from Korea
Yakama
96.0%
7TH GRADE
49.2/ 100
METRIC RATING
177th/ 347
METRIC RANK
91.7%
7TH GRADE
0.0/ 100
METRIC RATING
340th/ 347
METRIC RANK
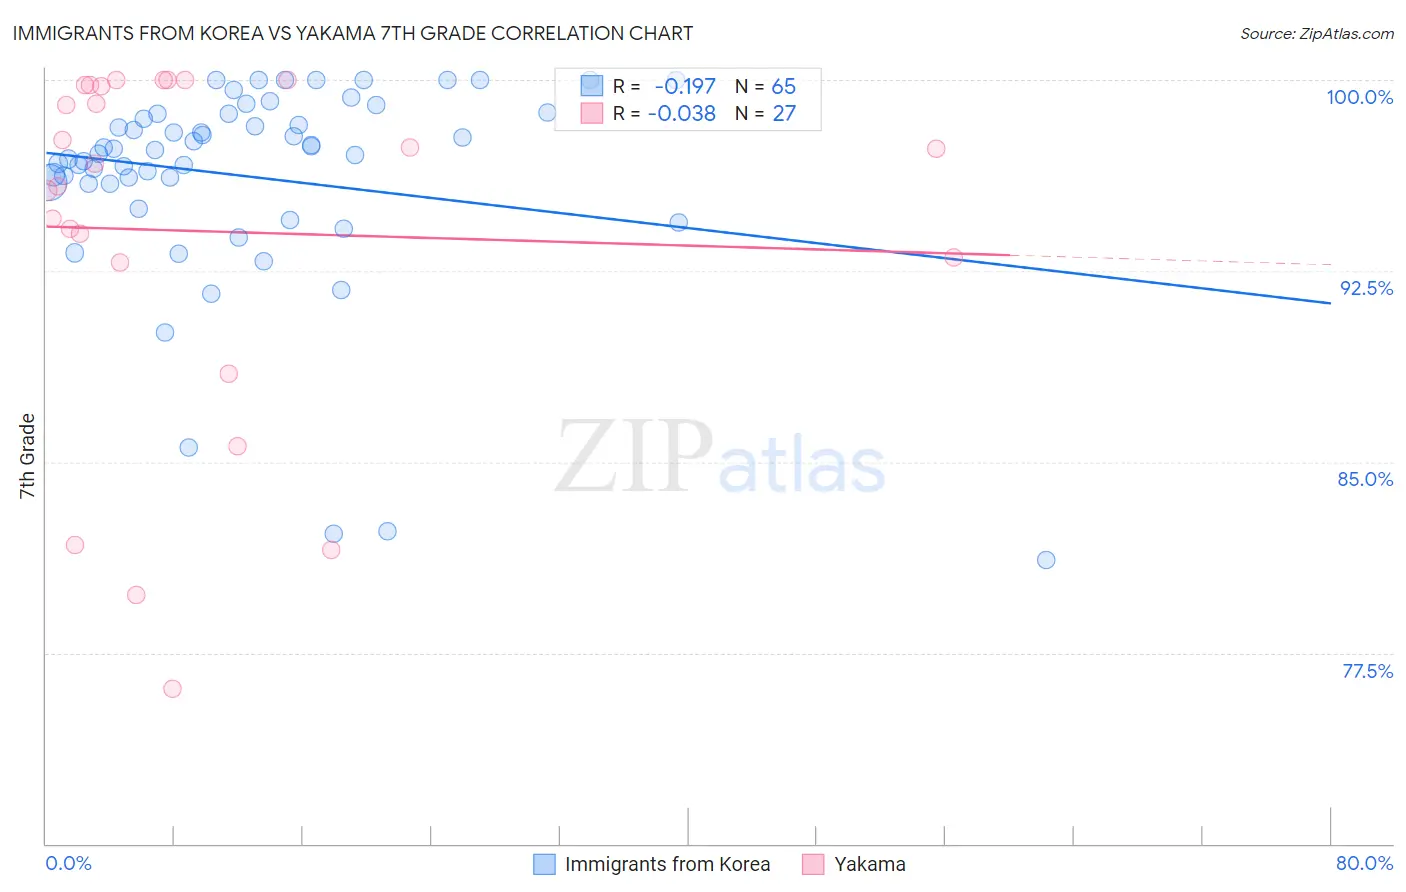
Immigrants from Korea vs Yakama 7th Grade Correlation Chart
The statistical analysis conducted on geographies consisting of 416,280,217 people shows a poor negative correlation between the proportion of Immigrants from Korea and percentage of population with at least 7th grade education in the United States with a correlation coefficient (R) of -0.197 and weighted average of 96.0%. Similarly, the statistical analysis conducted on geographies consisting of 19,923,144 people shows no correlation between the proportion of Yakama and percentage of population with at least 7th grade education in the United States with a correlation coefficient (R) of -0.038 and weighted average of 91.7%, a difference of 4.7%.
7th Grade Correlation Summary
| Measurement | Immigrants from Korea | Yakama |
| Minimum | 81.1% | 76.1% |
| Maximum | 100.0% | 100.0% |
| Range | 18.9% | 23.9% |
| Mean | 96.2% | 94.1% |
| Median | 97.2% | 96.7% |
| Interquartile 25% (IQ1) | 95.9% | 92.8% |
| Interquartile 75% (IQ3) | 98.7% | 99.8% |
| Interquartile Range (IQR) | 2.7% | 6.9% |
| Standard Deviation (Sample) | 4.1% | 7.1% |
| Standard Deviation (Population) | 4.1% | 7.0% |
Similar Demographics by 7th Grade
Demographics Similar to Immigrants from Korea by 7th Grade
In terms of 7th grade, the demographic groups most similar to Immigrants from Korea are Black/African American (96.0%, a difference of 0.0%), Chilean (96.0%, a difference of 0.0%), Marshallese (96.0%, a difference of 0.0%), Venezuelan (96.0%, a difference of 0.010%), and Immigrants from Albania (96.0%, a difference of 0.010%).
| Demographics | Rating | Rank | 7th Grade |
| Immigrants | Ukraine | 55.0 /100 | #170 | Average 96.1% |
| Egyptians | 54.2 /100 | #171 | Average 96.1% |
| Venezuelans | 51.4 /100 | #172 | Average 96.0% |
| Immigrants | Albania | 50.4 /100 | #173 | Average 96.0% |
| Mongolians | 50.0 /100 | #174 | Average 96.0% |
| Blacks/African Americans | 49.5 /100 | #175 | Average 96.0% |
| Chileans | 49.3 /100 | #176 | Average 96.0% |
| Immigrants | Korea | 49.2 /100 | #177 | Average 96.0% |
| Marshallese | 48.4 /100 | #178 | Average 96.0% |
| Immigrants | Iran | 47.8 /100 | #179 | Average 96.0% |
| Immigrants | Brazil | 46.8 /100 | #180 | Average 96.0% |
| Pakistanis | 44.5 /100 | #181 | Average 96.0% |
| Iraqis | 41.2 /100 | #182 | Average 96.0% |
| Immigrants | Spain | 38.8 /100 | #183 | Fair 96.0% |
| Sierra Leoneans | 37.5 /100 | #184 | Fair 96.0% |
Demographics Similar to Yakama by 7th Grade
In terms of 7th grade, the demographic groups most similar to Yakama are Guatemalan (91.7%, a difference of 0.020%), Mexican (91.9%, a difference of 0.20%), Salvadoran (91.5%, a difference of 0.29%), Central American (92.1%, a difference of 0.44%), and Immigrants from Guatemala (91.3%, a difference of 0.45%).
| Demographics | Rating | Rank | 7th Grade |
| Immigrants | Armenia | 0.0 /100 | #333 | Tragic 92.7% |
| Immigrants | Yemen | 0.0 /100 | #334 | Tragic 92.6% |
| Mexican American Indians | 0.0 /100 | #335 | Tragic 92.6% |
| Immigrants | Honduras | 0.0 /100 | #336 | Tragic 92.5% |
| Immigrants | Latin America | 0.0 /100 | #337 | Tragic 92.2% |
| Central Americans | 0.0 /100 | #338 | Tragic 92.1% |
| Mexicans | 0.0 /100 | #339 | Tragic 91.9% |
| Yakama | 0.0 /100 | #340 | Tragic 91.7% |
| Guatemalans | 0.0 /100 | #341 | Tragic 91.7% |
| Salvadorans | 0.0 /100 | #342 | Tragic 91.5% |
| Immigrants | Guatemala | 0.0 /100 | #343 | Tragic 91.3% |
| Immigrants | Central America | 0.0 /100 | #344 | Tragic 91.0% |
| Immigrants | El Salvador | 0.0 /100 | #345 | Tragic 90.9% |
| Immigrants | Mexico | 0.0 /100 | #346 | Tragic 90.7% |
| Spanish American Indians | 0.0 /100 | #347 | Tragic 90.3% |