Inupiat vs Czech Doctorate Degree
COMPARE
Inupiat
Czech
Doctorate Degree
Doctorate Degree Comparison
Inupiat
Czechs
1.3%
DOCTORATE DEGREE
0.0/ 100
METRIC RATING
328th/ 347
METRIC RANK
1.9%
DOCTORATE DEGREE
67.3/ 100
METRIC RATING
163rd/ 347
METRIC RANK
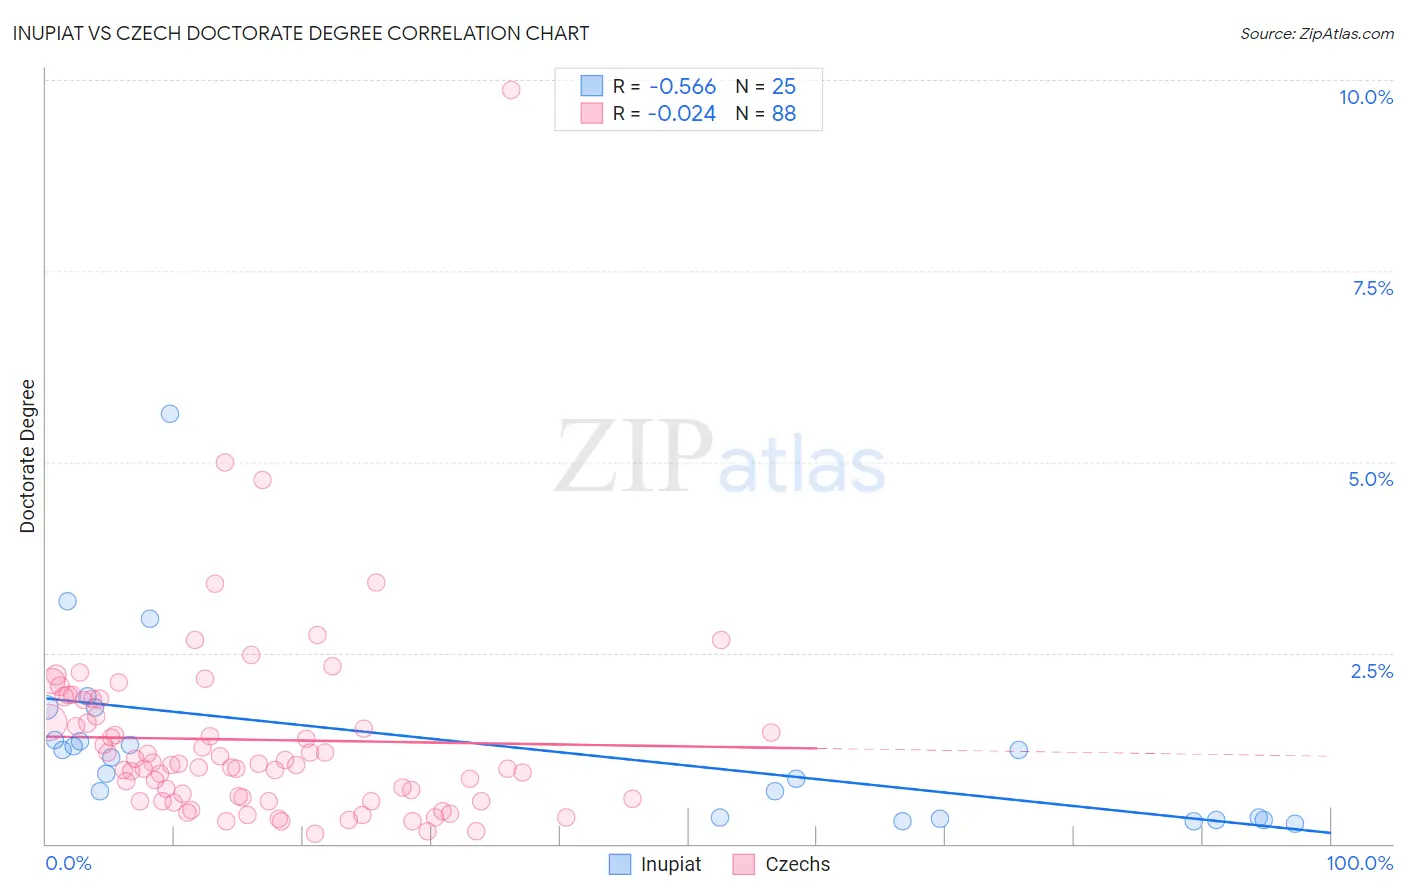
Inupiat vs Czech Doctorate Degree Correlation Chart
The statistical analysis conducted on geographies consisting of 95,805,354 people shows a substantial negative correlation between the proportion of Inupiat and percentage of population with at least doctorate degree education in the United States with a correlation coefficient (R) of -0.566 and weighted average of 1.3%. Similarly, the statistical analysis conducted on geographies consisting of 474,197,515 people shows no correlation between the proportion of Czechs and percentage of population with at least doctorate degree education in the United States with a correlation coefficient (R) of -0.024 and weighted average of 1.9%, a difference of 44.4%.
Doctorate Degree Correlation Summary
| Measurement | Inupiat | Czech |
| Minimum | 0.27% | 0.13% |
| Maximum | 5.6% | 9.9% |
| Range | 5.4% | 9.7% |
| Mean | 1.3% | 1.4% |
| Median | 1.1% | 1.0% |
| Interquartile 25% (IQ1) | 0.33% | 0.58% |
| Interquartile 75% (IQ3) | 1.6% | 1.8% |
| Interquartile Range (IQR) | 1.2% | 1.2% |
| Standard Deviation (Sample) | 1.2% | 1.3% |
| Standard Deviation (Population) | 1.2% | 1.3% |
Similar Demographics by Doctorate Degree
Demographics Similar to Inupiat by Doctorate Degree
In terms of doctorate degree, the demographic groups most similar to Inupiat are Haitian (1.3%, a difference of 0.050%), Yup'ik (1.3%, a difference of 0.27%), Immigrants from Latin America (1.3%, a difference of 0.28%), Hispanic or Latino (1.3%, a difference of 0.58%), and Immigrants from Cabo Verde (1.3%, a difference of 0.87%).
| Demographics | Rating | Rank | Doctorate Degree |
| Dutch West Indians | 0.1 /100 | #321 | Tragic 1.3% |
| Seminole | 0.1 /100 | #322 | Tragic 1.3% |
| Immigrants | Belize | 0.1 /100 | #323 | Tragic 1.3% |
| Natives/Alaskans | 0.0 /100 | #324 | Tragic 1.3% |
| Pima | 0.0 /100 | #325 | Tragic 1.3% |
| Immigrants | Cabo Verde | 0.0 /100 | #326 | Tragic 1.3% |
| Hispanics or Latinos | 0.0 /100 | #327 | Tragic 1.3% |
| Inupiat | 0.0 /100 | #328 | Tragic 1.3% |
| Haitians | 0.0 /100 | #329 | Tragic 1.3% |
| Yup'ik | 0.0 /100 | #330 | Tragic 1.3% |
| Immigrants | Latin America | 0.0 /100 | #331 | Tragic 1.3% |
| Yakama | 0.0 /100 | #332 | Tragic 1.3% |
| Immigrants | Caribbean | 0.0 /100 | #333 | Tragic 1.3% |
| Immigrants | Dominican Republic | 0.0 /100 | #334 | Tragic 1.3% |
| Immigrants | Haiti | 0.0 /100 | #335 | Tragic 1.3% |
Demographics Similar to Czechs by Doctorate Degree
In terms of doctorate degree, the demographic groups most similar to Czechs are Irish (1.9%, a difference of 0.040%), Celtic (1.9%, a difference of 0.10%), Immigrants from Middle Africa (1.9%, a difference of 0.25%), Welsh (1.9%, a difference of 0.40%), and Slovene (1.9%, a difference of 0.49%).
| Demographics | Rating | Rank | Doctorate Degree |
| Slavs | 72.4 /100 | #156 | Good 1.9% |
| Danes | 71.9 /100 | #157 | Good 1.9% |
| Hungarians | 71.7 /100 | #158 | Good 1.9% |
| Slovenes | 70.2 /100 | #159 | Good 1.9% |
| Welsh | 69.7 /100 | #160 | Good 1.9% |
| Immigrants | Middle Africa | 68.8 /100 | #161 | Good 1.9% |
| Irish | 67.5 /100 | #162 | Good 1.9% |
| Czechs | 67.3 /100 | #163 | Good 1.9% |
| Celtics | 66.7 /100 | #164 | Good 1.9% |
| Scotch-Irish | 63.6 /100 | #165 | Good 1.9% |
| Spaniards | 63.5 /100 | #166 | Good 1.9% |
| Macedonians | 60.9 /100 | #167 | Good 1.9% |
| Sri Lankans | 60.3 /100 | #168 | Good 1.9% |
| Vietnamese | 54.8 /100 | #169 | Average 1.9% |
| Costa Ricans | 53.3 /100 | #170 | Average 1.8% |