Inupiat vs Peruvian 5th Grade
COMPARE
Inupiat
Peruvian
5th Grade
5th Grade Comparison
Inupiat
Peruvians
98.4%
5TH GRADE
100.0/ 100
METRIC RATING
7th/ 347
METRIC RANK
96.8%
5TH GRADE
0.6/ 100
METRIC RATING
257th/ 347
METRIC RANK
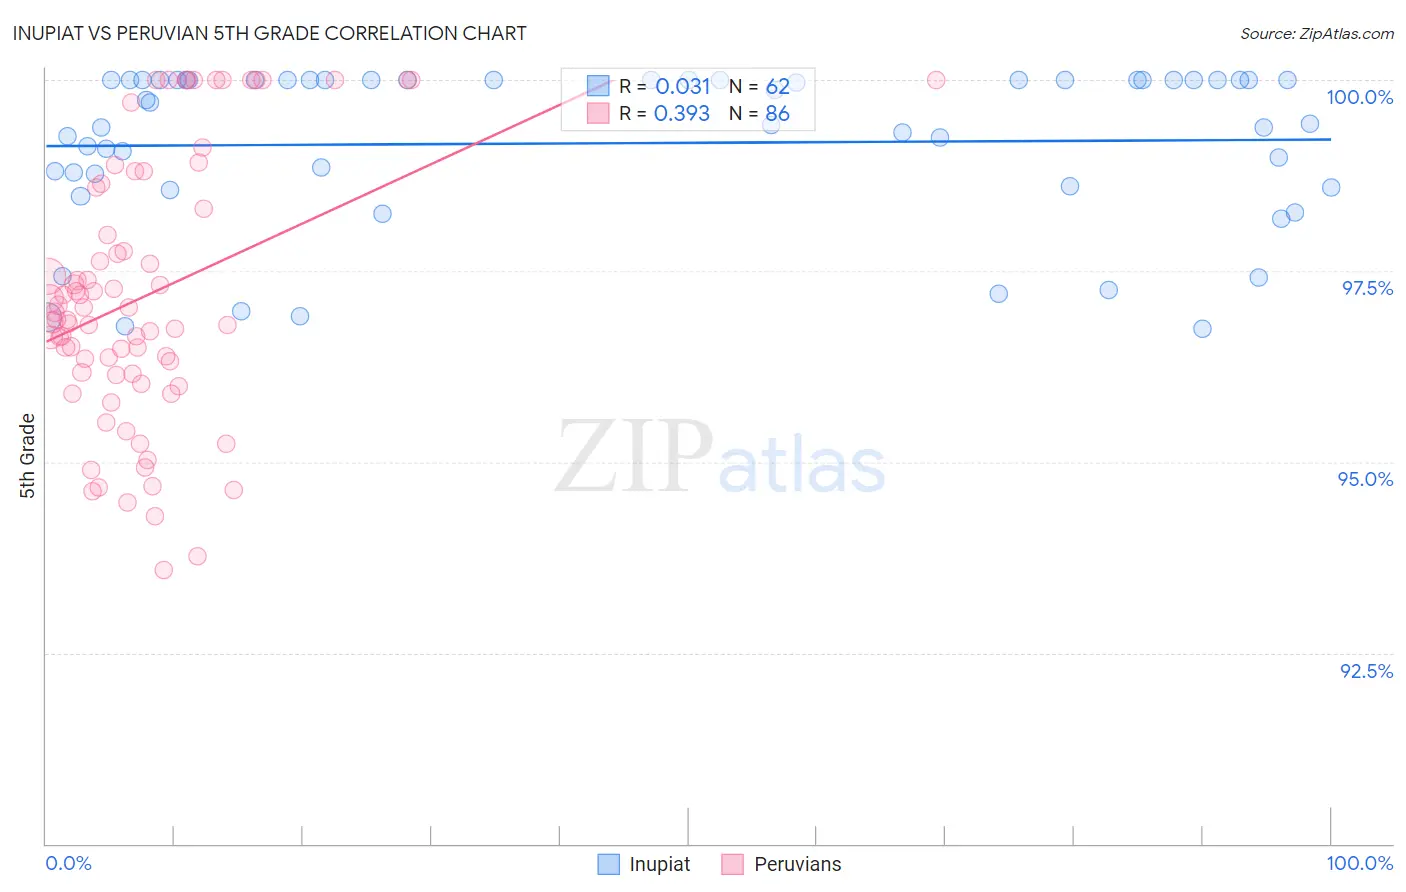
Inupiat vs Peruvian 5th Grade Correlation Chart
The statistical analysis conducted on geographies consisting of 96,348,974 people shows no correlation between the proportion of Inupiat and percentage of population with at least 5th grade education in the United States with a correlation coefficient (R) of 0.031 and weighted average of 98.4%. Similarly, the statistical analysis conducted on geographies consisting of 363,068,462 people shows a mild positive correlation between the proportion of Peruvians and percentage of population with at least 5th grade education in the United States with a correlation coefficient (R) of 0.393 and weighted average of 96.8%, a difference of 1.6%.
5th Grade Correlation Summary
| Measurement | Inupiat | Peruvian |
| Minimum | 96.7% | 93.6% |
| Maximum | 100.0% | 100.0% |
| Range | 3.3% | 6.4% |
| Mean | 99.2% | 97.2% |
| Median | 99.6% | 96.9% |
| Interquartile 25% (IQ1) | 98.6% | 96.2% |
| Interquartile 75% (IQ3) | 100.0% | 98.6% |
| Interquartile Range (IQR) | 1.4% | 2.4% |
| Standard Deviation (Sample) | 1.0% | 1.7% |
| Standard Deviation (Population) | 1.0% | 1.7% |
Similar Demographics by 5th Grade
Demographics Similar to Inupiat by 5th Grade
In terms of 5th grade, the demographic groups most similar to Inupiat are Slovene (98.3%, a difference of 0.020%), Slovak (98.4%, a difference of 0.030%), German (98.4%, a difference of 0.030%), Norwegian (98.4%, a difference of 0.050%), and Tsimshian (98.4%, a difference of 0.050%).
| Demographics | Rating | Rank | 5th Grade |
| Crow | 100.0 /100 | #1 | Exceptional 99.5% |
| Welsh | 100.0 /100 | #2 | Exceptional 98.6% |
| Norwegians | 100.0 /100 | #3 | Exceptional 98.4% |
| Tsimshian | 100.0 /100 | #4 | Exceptional 98.4% |
| Slovaks | 100.0 /100 | #5 | Exceptional 98.4% |
| Germans | 100.0 /100 | #6 | Exceptional 98.4% |
| Inupiat | 100.0 /100 | #7 | Exceptional 98.4% |
| Slovenes | 100.0 /100 | #8 | Exceptional 98.3% |
| Swedes | 100.0 /100 | #9 | Exceptional 98.3% |
| English | 100.0 /100 | #10 | Exceptional 98.3% |
| Alaskan Athabascans | 100.0 /100 | #11 | Exceptional 98.3% |
| Carpatho Rusyns | 100.0 /100 | #12 | Exceptional 98.3% |
| Tlingit-Haida | 100.0 /100 | #13 | Exceptional 98.3% |
| Dutch | 100.0 /100 | #14 | Exceptional 98.3% |
| Scottish | 100.0 /100 | #15 | Exceptional 98.3% |
Demographics Similar to Peruvians by 5th Grade
In terms of 5th grade, the demographic groups most similar to Peruvians are Immigrants from Congo (96.8%, a difference of 0.0%), South American (96.8%, a difference of 0.010%), Immigrants from Middle Africa (96.8%, a difference of 0.030%), Immigrants from Senegal (96.8%, a difference of 0.030%), and Immigrants from Ethiopia (96.8%, a difference of 0.030%).
| Demographics | Rating | Rank | 5th Grade |
| Immigrants | Liberia | 1.0 /100 | #250 | Tragic 96.9% |
| Bolivians | 0.9 /100 | #251 | Tragic 96.9% |
| Jamaicans | 0.9 /100 | #252 | Tragic 96.9% |
| Immigrants | Middle Africa | 0.8 /100 | #253 | Tragic 96.8% |
| Immigrants | Senegal | 0.8 /100 | #254 | Tragic 96.8% |
| South Americans | 0.7 /100 | #255 | Tragic 96.8% |
| Immigrants | Congo | 0.7 /100 | #256 | Tragic 96.8% |
| Peruvians | 0.6 /100 | #257 | Tragic 96.8% |
| Immigrants | Ethiopia | 0.5 /100 | #258 | Tragic 96.8% |
| Immigrants | China | 0.5 /100 | #259 | Tragic 96.8% |
| Immigrants | Jamaica | 0.4 /100 | #260 | Tragic 96.8% |
| Immigrants | Sierra Leone | 0.4 /100 | #261 | Tragic 96.8% |
| Immigrants | Colombia | 0.4 /100 | #262 | Tragic 96.8% |
| Immigrants | Uzbekistan | 0.3 /100 | #263 | Tragic 96.8% |
| West Indians | 0.3 /100 | #264 | Tragic 96.8% |