Dominican vs Immigrants from Argentina 5th Grade
COMPARE
Dominican
Immigrants from Argentina
5th Grade
5th Grade Comparison
Dominicans
Immigrants from Argentina
95.5%
5TH GRADE
0.0/ 100
METRIC RATING
327th/ 347
METRIC RANK
97.3%
5TH GRADE
36.1/ 100
METRIC RATING
186th/ 347
METRIC RANK
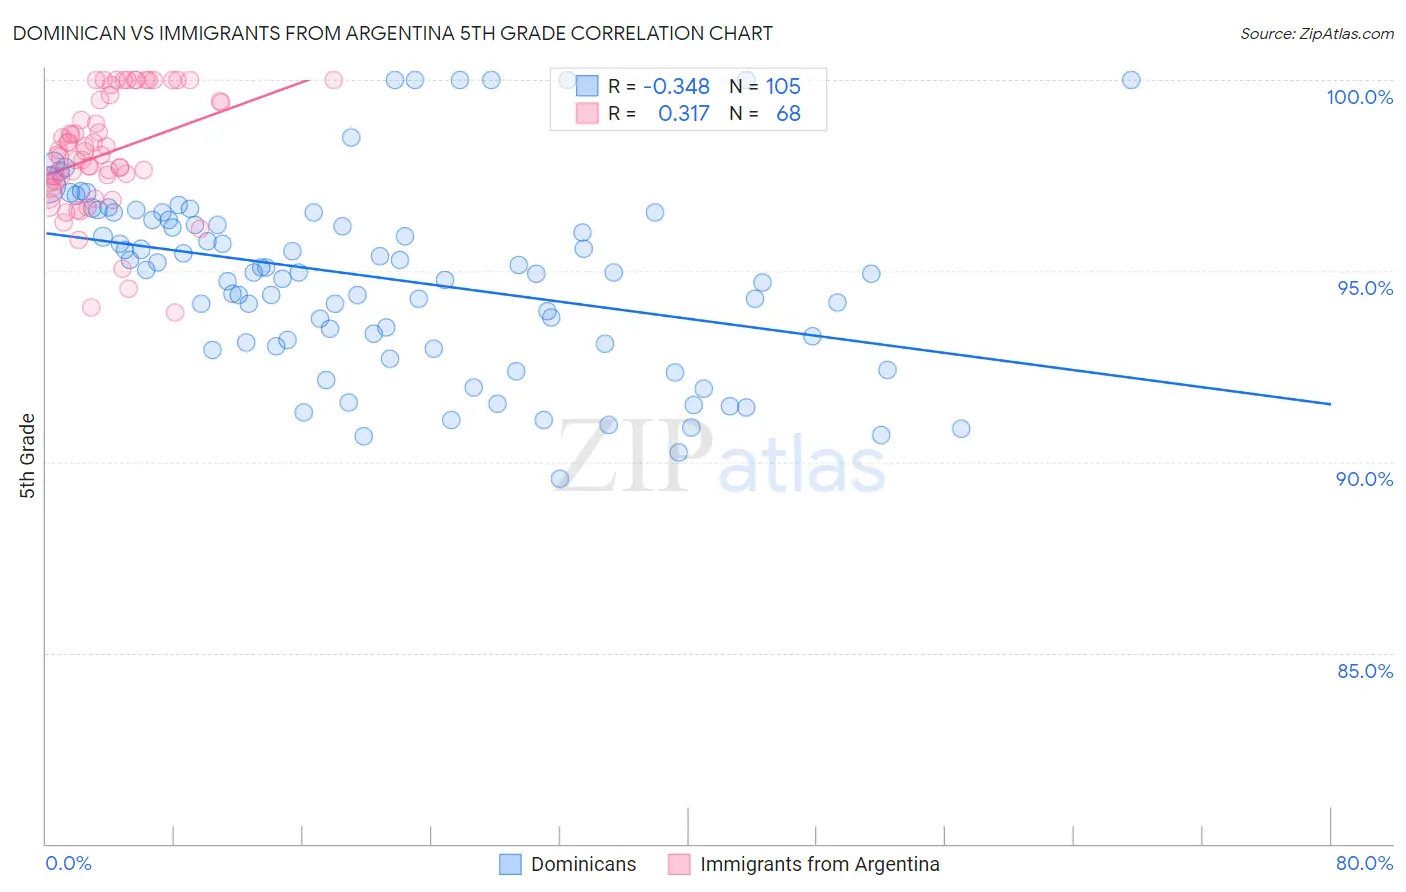
Dominican vs Immigrants from Argentina 5th Grade Correlation Chart
The statistical analysis conducted on geographies consisting of 355,142,603 people shows a mild negative correlation between the proportion of Dominicans and percentage of population with at least 5th grade education in the United States with a correlation coefficient (R) of -0.348 and weighted average of 95.5%. Similarly, the statistical analysis conducted on geographies consisting of 264,434,317 people shows a mild positive correlation between the proportion of Immigrants from Argentina and percentage of population with at least 5th grade education in the United States with a correlation coefficient (R) of 0.317 and weighted average of 97.3%, a difference of 1.8%.
5th Grade Correlation Summary
| Measurement | Dominican | Immigrants from Argentina |
| Minimum | 89.6% | 93.9% |
| Maximum | 100.0% | 100.0% |
| Range | 10.4% | 6.1% |
| Mean | 94.8% | 98.1% |
| Median | 95.0% | 98.0% |
| Interquartile 25% (IQ1) | 93.1% | 97.3% |
| Interquartile 75% (IQ3) | 96.4% | 99.5% |
| Interquartile Range (IQR) | 3.3% | 2.1% |
| Standard Deviation (Sample) | 2.4% | 1.5% |
| Standard Deviation (Population) | 2.4% | 1.5% |
Similar Demographics by 5th Grade
Demographics Similar to Dominicans by 5th Grade
In terms of 5th grade, the demographic groups most similar to Dominicans are Immigrants from Cambodia (95.5%, a difference of 0.0%), Honduran (95.6%, a difference of 0.030%), Hispanic or Latino (95.6%, a difference of 0.030%), Cape Verdean (95.5%, a difference of 0.030%), and Mexican American Indian (95.5%, a difference of 0.040%).
| Demographics | Rating | Rank | 5th Grade |
| Central American Indians | 0.0 /100 | #320 | Tragic 95.7% |
| Immigrants | Belize | 0.0 /100 | #321 | Tragic 95.7% |
| Immigrants | Nicaragua | 0.0 /100 | #322 | Tragic 95.6% |
| Immigrants | Fiji | 0.0 /100 | #323 | Tragic 95.6% |
| Hondurans | 0.0 /100 | #324 | Tragic 95.6% |
| Hispanics or Latinos | 0.0 /100 | #325 | Tragic 95.6% |
| Immigrants | Cambodia | 0.0 /100 | #326 | Tragic 95.5% |
| Dominicans | 0.0 /100 | #327 | Tragic 95.5% |
| Cape Verdeans | 0.0 /100 | #328 | Tragic 95.5% |
| Mexican American Indians | 0.0 /100 | #329 | Tragic 95.5% |
| Immigrants | Armenia | 0.0 /100 | #330 | Tragic 95.4% |
| Immigrants | Honduras | 0.0 /100 | #331 | Tragic 95.4% |
| Immigrants | Dominican Republic | 0.0 /100 | #332 | Tragic 95.3% |
| Immigrants | Latin America | 0.0 /100 | #333 | Tragic 95.3% |
| Nepalese | 0.0 /100 | #334 | Tragic 95.2% |
Demographics Similar to Immigrants from Argentina by 5th Grade
In terms of 5th grade, the demographic groups most similar to Immigrants from Argentina are Dutch West Indian (97.3%, a difference of 0.0%), Mongolian (97.3%, a difference of 0.010%), Immigrants from Ukraine (97.3%, a difference of 0.010%), Immigrants from Venezuela (97.3%, a difference of 0.010%), and Spanish American (97.3%, a difference of 0.010%).
| Demographics | Rating | Rank | 5th Grade |
| Immigrants | Kenya | 40.3 /100 | #179 | Average 97.3% |
| Pakistanis | 40.2 /100 | #180 | Average 97.3% |
| Argentineans | 39.5 /100 | #181 | Fair 97.3% |
| Mongolians | 39.4 /100 | #182 | Fair 97.3% |
| Immigrants | Ukraine | 38.6 /100 | #183 | Fair 97.3% |
| Immigrants | Venezuela | 38.4 /100 | #184 | Fair 97.3% |
| Dutch West Indians | 36.2 /100 | #185 | Fair 97.3% |
| Immigrants | Argentina | 36.1 /100 | #186 | Fair 97.3% |
| Spanish Americans | 34.7 /100 | #187 | Fair 97.3% |
| Paraguayans | 33.7 /100 | #188 | Fair 97.3% |
| Immigrants | Egypt | 32.9 /100 | #189 | Fair 97.3% |
| Blacks/African Americans | 31.8 /100 | #190 | Fair 97.3% |
| Immigrants | Brazil | 31.5 /100 | #191 | Fair 97.3% |
| Panamanians | 31.3 /100 | #192 | Fair 97.3% |
| Navajo | 29.0 /100 | #193 | Fair 97.2% |