Indonesian vs Somali 8th Grade
COMPARE
Indonesian
Somali
8th Grade
8th Grade Comparison
Indonesians
Somalis
94.1%
8TH GRADE
0.0/ 100
METRIC RATING
298th/ 347
METRIC RANK
95.1%
8TH GRADE
1.4/ 100
METRIC RATING
246th/ 347
METRIC RANK
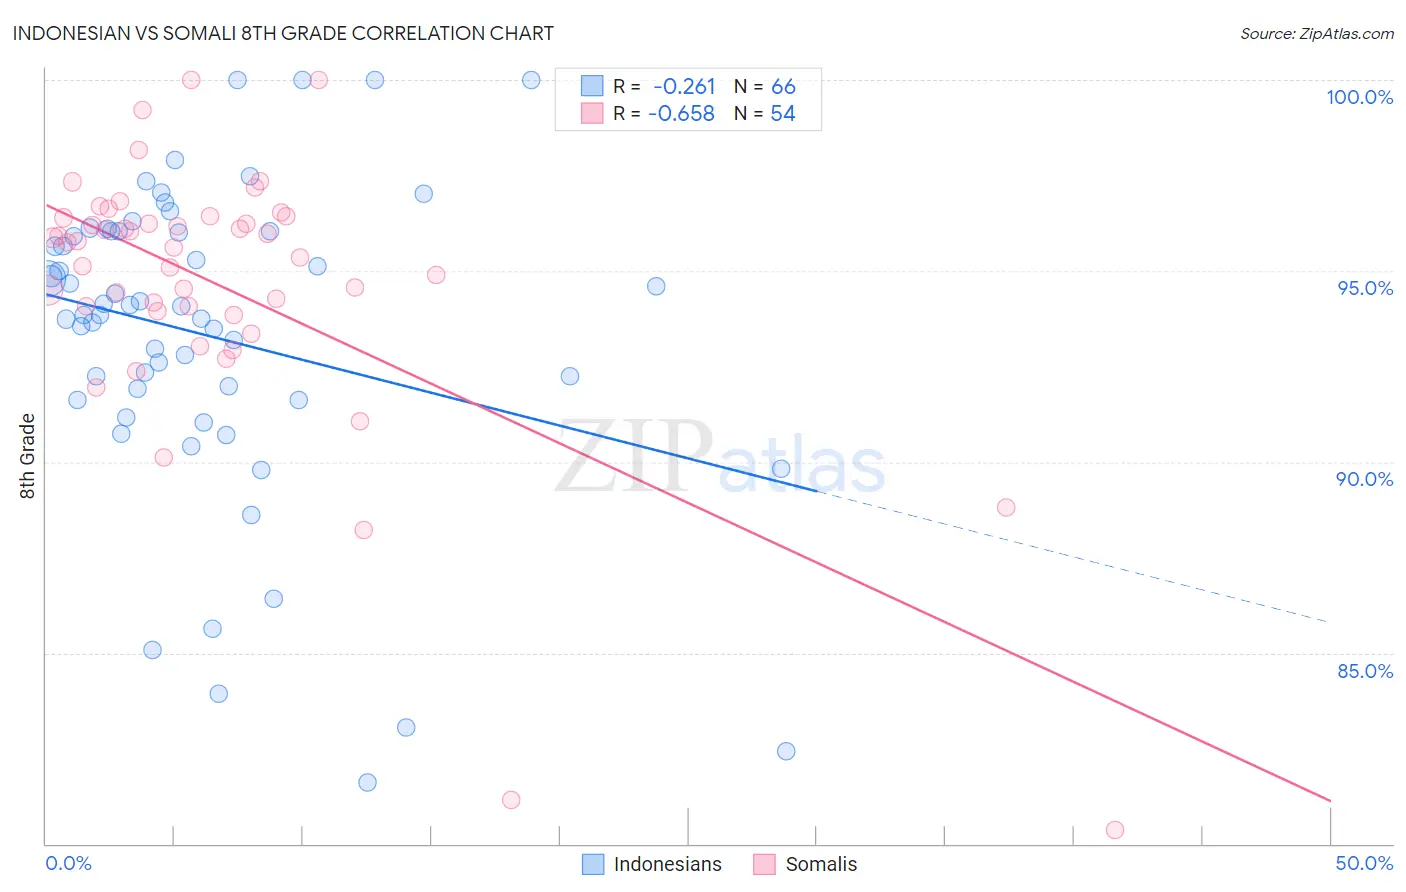
Indonesian vs Somali 8th Grade Correlation Chart
The statistical analysis conducted on geographies consisting of 162,727,113 people shows a weak negative correlation between the proportion of Indonesians and percentage of population with at least 8th grade education in the United States with a correlation coefficient (R) of -0.261 and weighted average of 94.1%. Similarly, the statistical analysis conducted on geographies consisting of 99,332,457 people shows a significant negative correlation between the proportion of Somalis and percentage of population with at least 8th grade education in the United States with a correlation coefficient (R) of -0.658 and weighted average of 95.1%, a difference of 0.98%.
8th Grade Correlation Summary
| Measurement | Indonesian | Somali |
| Minimum | 81.6% | 80.4% |
| Maximum | 100.0% | 100.0% |
| Range | 18.4% | 19.6% |
| Mean | 93.3% | 94.6% |
| Median | 94.0% | 95.7% |
| Interquartile 25% (IQ1) | 91.6% | 94.0% |
| Interquartile 75% (IQ3) | 96.0% | 96.4% |
| Interquartile Range (IQR) | 4.4% | 2.4% |
| Standard Deviation (Sample) | 4.1% | 3.6% |
| Standard Deviation (Population) | 4.1% | 3.6% |
Similar Demographics by 8th Grade
Demographics Similar to Indonesians by 8th Grade
In terms of 8th grade, the demographic groups most similar to Indonesians are Cuban (94.1%, a difference of 0.030%), Immigrants from Burma/Myanmar (94.1%, a difference of 0.030%), Immigrants from South Eastern Asia (94.2%, a difference of 0.040%), Haitian (94.2%, a difference of 0.050%), and Immigrants from Laos (94.1%, a difference of 0.050%).
| Demographics | Rating | Rank | 8th Grade |
| Immigrants | Grenada | 0.0 /100 | #291 | Tragic 94.3% |
| Bangladeshis | 0.0 /100 | #292 | Tragic 94.3% |
| Yaqui | 0.0 /100 | #293 | Tragic 94.2% |
| Houma | 0.0 /100 | #294 | Tragic 94.2% |
| Fijians | 0.0 /100 | #295 | Tragic 94.2% |
| Haitians | 0.0 /100 | #296 | Tragic 94.2% |
| Immigrants | South Eastern Asia | 0.0 /100 | #297 | Tragic 94.2% |
| Indonesians | 0.0 /100 | #298 | Tragic 94.1% |
| Cubans | 0.0 /100 | #299 | Tragic 94.1% |
| Immigrants | Burma/Myanmar | 0.0 /100 | #300 | Tragic 94.1% |
| Immigrants | Laos | 0.0 /100 | #301 | Tragic 94.1% |
| Sri Lankans | 0.0 /100 | #302 | Tragic 94.0% |
| Immigrants | Dominica | 0.0 /100 | #303 | Tragic 94.0% |
| Guyanese | 0.0 /100 | #304 | Tragic 93.9% |
| Immigrants | Haiti | 0.0 /100 | #305 | Tragic 93.9% |
Demographics Similar to Somalis by 8th Grade
In terms of 8th grade, the demographic groups most similar to Somalis are Immigrants from Senegal (95.1%, a difference of 0.0%), Jamaican (95.1%, a difference of 0.010%), Uruguayan (95.1%, a difference of 0.020%), Tongan (95.1%, a difference of 0.040%), and Paiute (95.1%, a difference of 0.040%).
| Demographics | Rating | Rank | 8th Grade |
| Immigrants | Sierra Leone | 2.1 /100 | #239 | Tragic 95.1% |
| Ethiopians | 2.0 /100 | #240 | Tragic 95.1% |
| South American Indians | 1.9 /100 | #241 | Tragic 95.1% |
| Tongans | 1.7 /100 | #242 | Tragic 95.1% |
| Paiute | 1.7 /100 | #243 | Tragic 95.1% |
| Immigrants | Middle Africa | 1.7 /100 | #244 | Tragic 95.1% |
| Jamaicans | 1.4 /100 | #245 | Tragic 95.1% |
| Somalis | 1.4 /100 | #246 | Tragic 95.1% |
| Immigrants | Senegal | 1.4 /100 | #247 | Tragic 95.1% |
| Uruguayans | 1.2 /100 | #248 | Tragic 95.1% |
| Immigrants | China | 1.1 /100 | #249 | Tragic 95.0% |
| Koreans | 1.1 /100 | #250 | Tragic 95.0% |
| Bolivians | 1.0 /100 | #251 | Tragic 95.0% |
| Immigrants | Ethiopia | 1.0 /100 | #252 | Tragic 95.0% |
| U.S. Virgin Islanders | 0.9 /100 | #253 | Tragic 95.0% |