Albanian vs European Doctorate Degree
COMPARE
Albanian
European
Doctorate Degree
Doctorate Degree Comparison
Albanians
Europeans
1.9%
DOCTORATE DEGREE
74.8/ 100
METRIC RATING
151st/ 347
METRIC RANK
2.1%
DOCTORATE DEGREE
97.5/ 100
METRIC RATING
107th/ 347
METRIC RANK
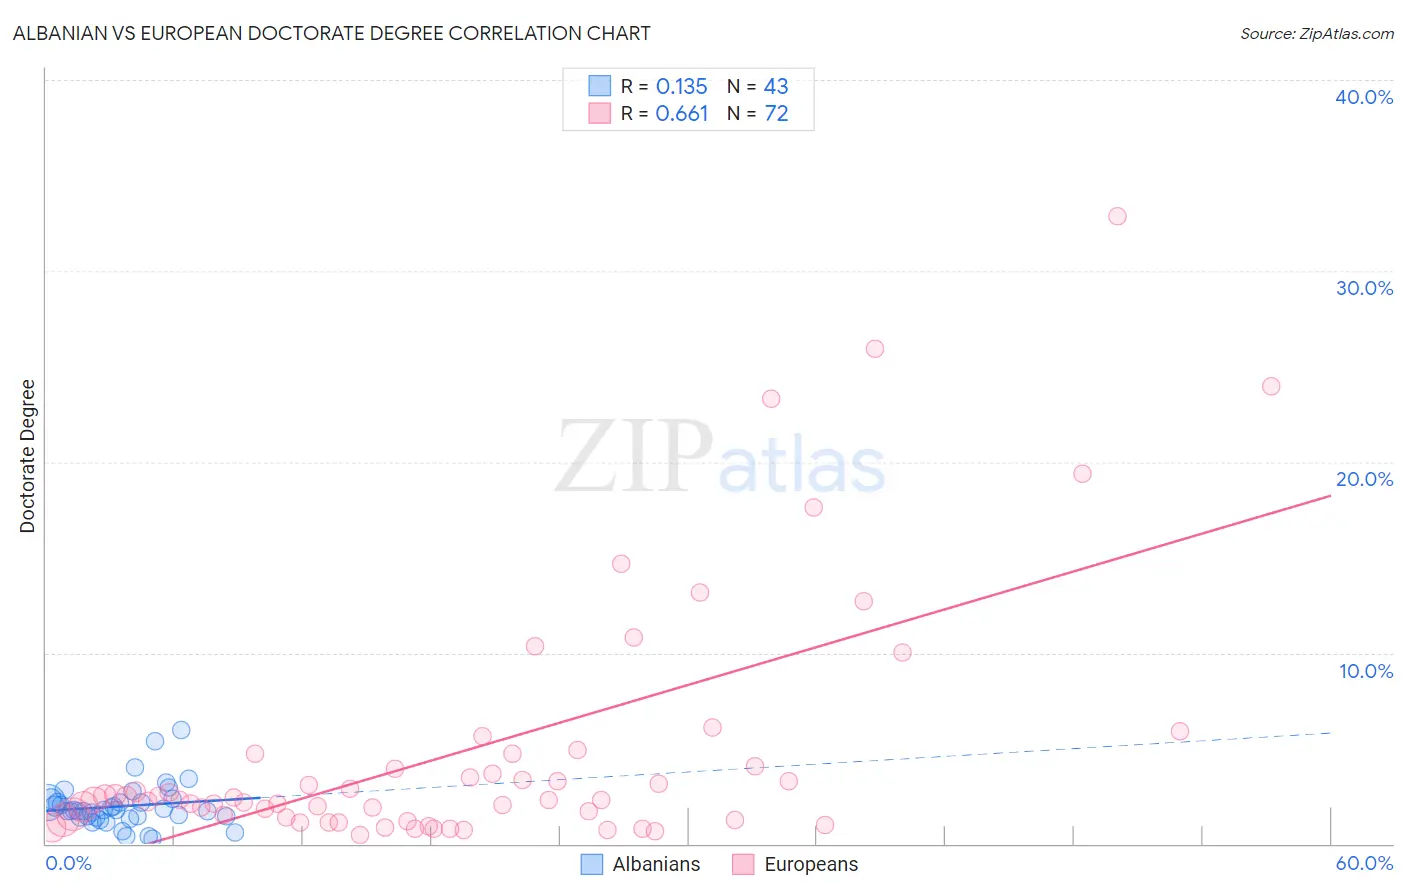
Albanian vs European Doctorate Degree Correlation Chart
The statistical analysis conducted on geographies consisting of 192,567,939 people shows a poor positive correlation between the proportion of Albanians and percentage of population with at least doctorate degree education in the United States with a correlation coefficient (R) of 0.135 and weighted average of 1.9%. Similarly, the statistical analysis conducted on geographies consisting of 540,466,833 people shows a significant positive correlation between the proportion of Europeans and percentage of population with at least doctorate degree education in the United States with a correlation coefficient (R) of 0.661 and weighted average of 2.1%, a difference of 9.0%.
Doctorate Degree Correlation Summary
| Measurement | Albanian | European |
| Minimum | 0.26% | 0.48% |
| Maximum | 6.0% | 32.8% |
| Range | 5.7% | 32.4% |
| Mean | 2.0% | 4.9% |
| Median | 1.7% | 2.3% |
| Interquartile 25% (IQ1) | 1.4% | 1.3% |
| Interquartile 75% (IQ3) | 2.2% | 4.4% |
| Interquartile Range (IQR) | 0.81% | 3.1% |
| Standard Deviation (Sample) | 1.1% | 6.6% |
| Standard Deviation (Population) | 1.1% | 6.6% |
Similar Demographics by Doctorate Degree
Demographics Similar to Albanians by Doctorate Degree
In terms of doctorate degree, the demographic groups most similar to Albanians are Immigrants from Kenya (1.9%, a difference of 0.10%), Immigrants from Oceania (1.9%, a difference of 0.15%), English (1.9%, a difference of 0.19%), Immigrants from Albania (1.9%, a difference of 0.37%), and Polish (1.9%, a difference of 0.39%).
| Demographics | Rating | Rank | Doctorate Degree |
| Immigrants | Moldova | 84.3 /100 | #144 | Excellent 2.0% |
| Kenyans | 83.6 /100 | #145 | Excellent 1.9% |
| Immigrants | Syria | 83.6 /100 | #146 | Excellent 1.9% |
| Immigrants | Senegal | 82.5 /100 | #147 | Excellent 1.9% |
| Luxembourgers | 81.1 /100 | #148 | Excellent 1.9% |
| Basques | 76.9 /100 | #149 | Good 1.9% |
| English | 75.9 /100 | #150 | Good 1.9% |
| Albanians | 74.8 /100 | #151 | Good 1.9% |
| Immigrants | Kenya | 74.3 /100 | #152 | Good 1.9% |
| Immigrants | Oceania | 74.0 /100 | #153 | Good 1.9% |
| Immigrants | Albania | 72.8 /100 | #154 | Good 1.9% |
| Poles | 72.7 /100 | #155 | Good 1.9% |
| Slavs | 72.4 /100 | #156 | Good 1.9% |
| Danes | 71.9 /100 | #157 | Good 1.9% |
| Hungarians | 71.7 /100 | #158 | Good 1.9% |
Demographics Similar to Europeans by Doctorate Degree
In terms of doctorate degree, the demographic groups most similar to Europeans are Immigrants from Germany (2.1%, a difference of 0.22%), Ukrainian (2.1%, a difference of 0.28%), Brazilian (2.1%, a difference of 0.35%), Sudanese (2.1%, a difference of 0.39%), and Immigrants from Pakistan (2.1%, a difference of 0.41%).
| Demographics | Rating | Rank | Doctorate Degree |
| Immigrants | Eastern Europe | 98.2 /100 | #100 | Exceptional 2.1% |
| Immigrants | Eastern Africa | 98.2 /100 | #101 | Exceptional 2.1% |
| Immigrants | Chile | 98.1 /100 | #102 | Exceptional 2.1% |
| Romanians | 98.1 /100 | #103 | Exceptional 2.1% |
| Austrians | 98.0 /100 | #104 | Exceptional 2.1% |
| Arabs | 97.8 /100 | #105 | Exceptional 2.1% |
| Sudanese | 97.7 /100 | #106 | Exceptional 2.1% |
| Europeans | 97.5 /100 | #107 | Exceptional 2.1% |
| Immigrants | Germany | 97.3 /100 | #108 | Exceptional 2.1% |
| Ukrainians | 97.2 /100 | #109 | Exceptional 2.1% |
| Brazilians | 97.2 /100 | #110 | Exceptional 2.1% |
| Immigrants | Pakistan | 97.1 /100 | #111 | Exceptional 2.1% |
| Syrians | 97.1 /100 | #112 | Exceptional 2.1% |
| Immigrants | Italy | 96.9 /100 | #113 | Exceptional 2.1% |
| Immigrants | Croatia | 96.8 /100 | #114 | Exceptional 2.1% |