Haitian vs European Doctorate Degree
COMPARE
Haitian
European
Doctorate Degree
Doctorate Degree Comparison
Haitians
Europeans
1.3%
DOCTORATE DEGREE
0.0/ 100
METRIC RATING
329th/ 347
METRIC RANK
2.1%
DOCTORATE DEGREE
97.5/ 100
METRIC RATING
107th/ 347
METRIC RANK
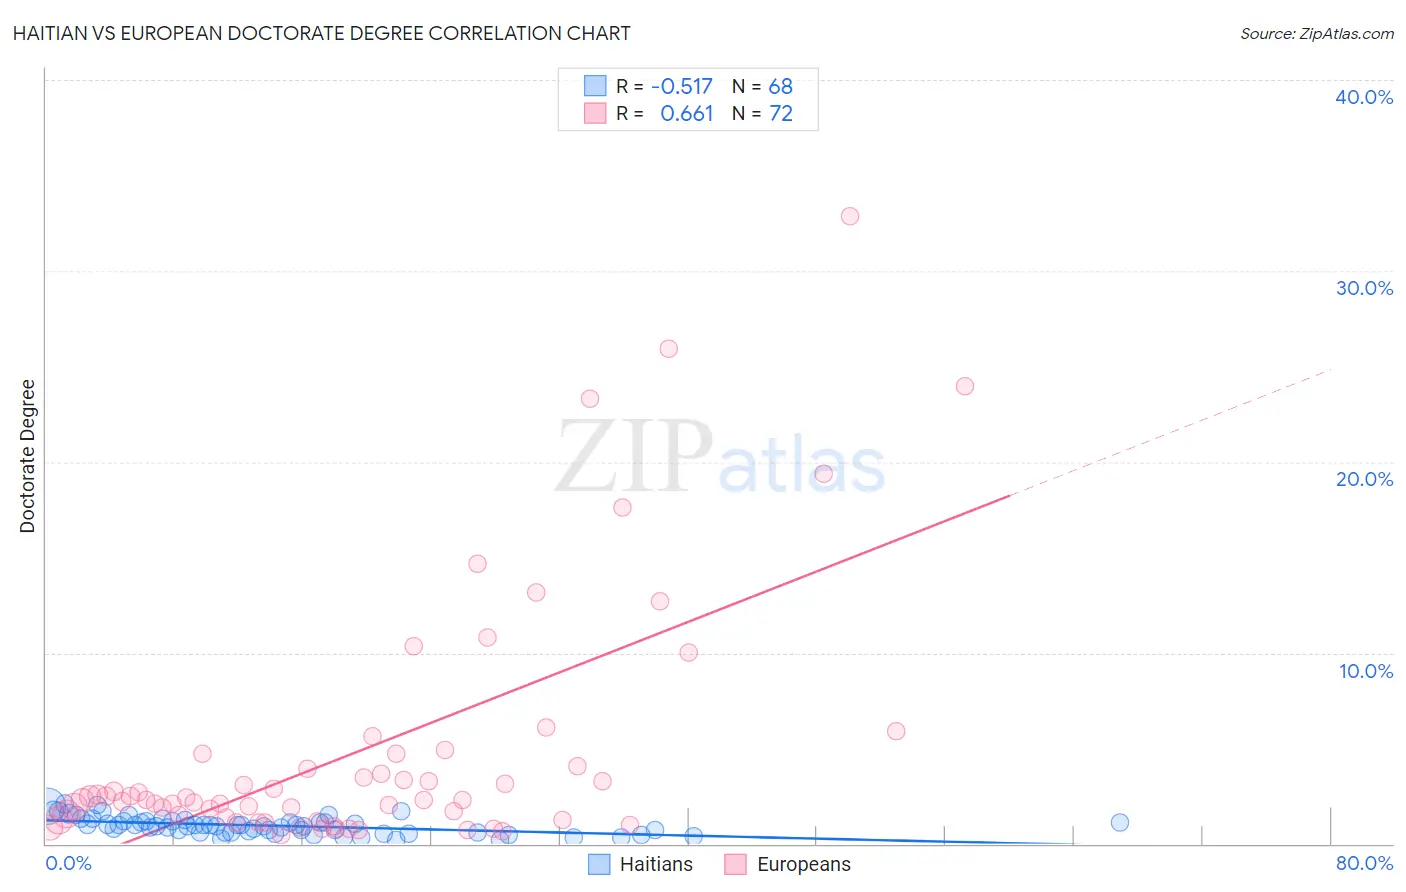
Haitian vs European Doctorate Degree Correlation Chart
The statistical analysis conducted on geographies consisting of 285,866,537 people shows a substantial negative correlation between the proportion of Haitians and percentage of population with at least doctorate degree education in the United States with a correlation coefficient (R) of -0.517 and weighted average of 1.3%. Similarly, the statistical analysis conducted on geographies consisting of 540,466,833 people shows a significant positive correlation between the proportion of Europeans and percentage of population with at least doctorate degree education in the United States with a correlation coefficient (R) of 0.661 and weighted average of 2.1%, a difference of 59.5%.
Doctorate Degree Correlation Summary
| Measurement | Haitian | European |
| Minimum | 0.17% | 0.48% |
| Maximum | 2.1% | 32.8% |
| Range | 1.9% | 32.4% |
| Mean | 0.95% | 4.9% |
| Median | 0.95% | 2.3% |
| Interquartile 25% (IQ1) | 0.60% | 1.3% |
| Interquartile 75% (IQ3) | 1.2% | 4.4% |
| Interquartile Range (IQR) | 0.58% | 3.1% |
| Standard Deviation (Sample) | 0.45% | 6.6% |
| Standard Deviation (Population) | 0.45% | 6.6% |
Similar Demographics by Doctorate Degree
Demographics Similar to Haitians by Doctorate Degree
In terms of doctorate degree, the demographic groups most similar to Haitians are Inupiat (1.3%, a difference of 0.050%), Yup'ik (1.3%, a difference of 0.22%), Immigrants from Latin America (1.3%, a difference of 0.23%), Hispanic or Latino (1.3%, a difference of 0.63%), and Immigrants from Cabo Verde (1.3%, a difference of 0.92%).
| Demographics | Rating | Rank | Doctorate Degree |
| Seminole | 0.1 /100 | #322 | Tragic 1.3% |
| Immigrants | Belize | 0.1 /100 | #323 | Tragic 1.3% |
| Natives/Alaskans | 0.0 /100 | #324 | Tragic 1.3% |
| Pima | 0.0 /100 | #325 | Tragic 1.3% |
| Immigrants | Cabo Verde | 0.0 /100 | #326 | Tragic 1.3% |
| Hispanics or Latinos | 0.0 /100 | #327 | Tragic 1.3% |
| Inupiat | 0.0 /100 | #328 | Tragic 1.3% |
| Haitians | 0.0 /100 | #329 | Tragic 1.3% |
| Yup'ik | 0.0 /100 | #330 | Tragic 1.3% |
| Immigrants | Latin America | 0.0 /100 | #331 | Tragic 1.3% |
| Yakama | 0.0 /100 | #332 | Tragic 1.3% |
| Immigrants | Caribbean | 0.0 /100 | #333 | Tragic 1.3% |
| Immigrants | Dominican Republic | 0.0 /100 | #334 | Tragic 1.3% |
| Immigrants | Haiti | 0.0 /100 | #335 | Tragic 1.3% |
| Nepalese | 0.0 /100 | #336 | Tragic 1.3% |
Demographics Similar to Europeans by Doctorate Degree
In terms of doctorate degree, the demographic groups most similar to Europeans are Immigrants from Germany (2.1%, a difference of 0.22%), Ukrainian (2.1%, a difference of 0.28%), Brazilian (2.1%, a difference of 0.35%), Sudanese (2.1%, a difference of 0.39%), and Immigrants from Pakistan (2.1%, a difference of 0.41%).
| Demographics | Rating | Rank | Doctorate Degree |
| Immigrants | Eastern Europe | 98.2 /100 | #100 | Exceptional 2.1% |
| Immigrants | Eastern Africa | 98.2 /100 | #101 | Exceptional 2.1% |
| Immigrants | Chile | 98.1 /100 | #102 | Exceptional 2.1% |
| Romanians | 98.1 /100 | #103 | Exceptional 2.1% |
| Austrians | 98.0 /100 | #104 | Exceptional 2.1% |
| Arabs | 97.8 /100 | #105 | Exceptional 2.1% |
| Sudanese | 97.7 /100 | #106 | Exceptional 2.1% |
| Europeans | 97.5 /100 | #107 | Exceptional 2.1% |
| Immigrants | Germany | 97.3 /100 | #108 | Exceptional 2.1% |
| Ukrainians | 97.2 /100 | #109 | Exceptional 2.1% |
| Brazilians | 97.2 /100 | #110 | Exceptional 2.1% |
| Immigrants | Pakistan | 97.1 /100 | #111 | Exceptional 2.1% |
| Syrians | 97.1 /100 | #112 | Exceptional 2.1% |
| Immigrants | Italy | 96.9 /100 | #113 | Exceptional 2.1% |
| Immigrants | Croatia | 96.8 /100 | #114 | Exceptional 2.1% |