Indian (Asian) vs Portuguese High School Diploma
COMPARE
Indian (Asian)
Portuguese
High School Diploma
High School Diploma Comparison
Indians (Asian)
Portuguese
89.6%
HIGH SCHOOL DIPLOMA
78.8/ 100
METRIC RATING
142nd/ 347
METRIC RANK
88.5%
HIGH SCHOOL DIPLOMA
14.4/ 100
METRIC RATING
208th/ 347
METRIC RANK
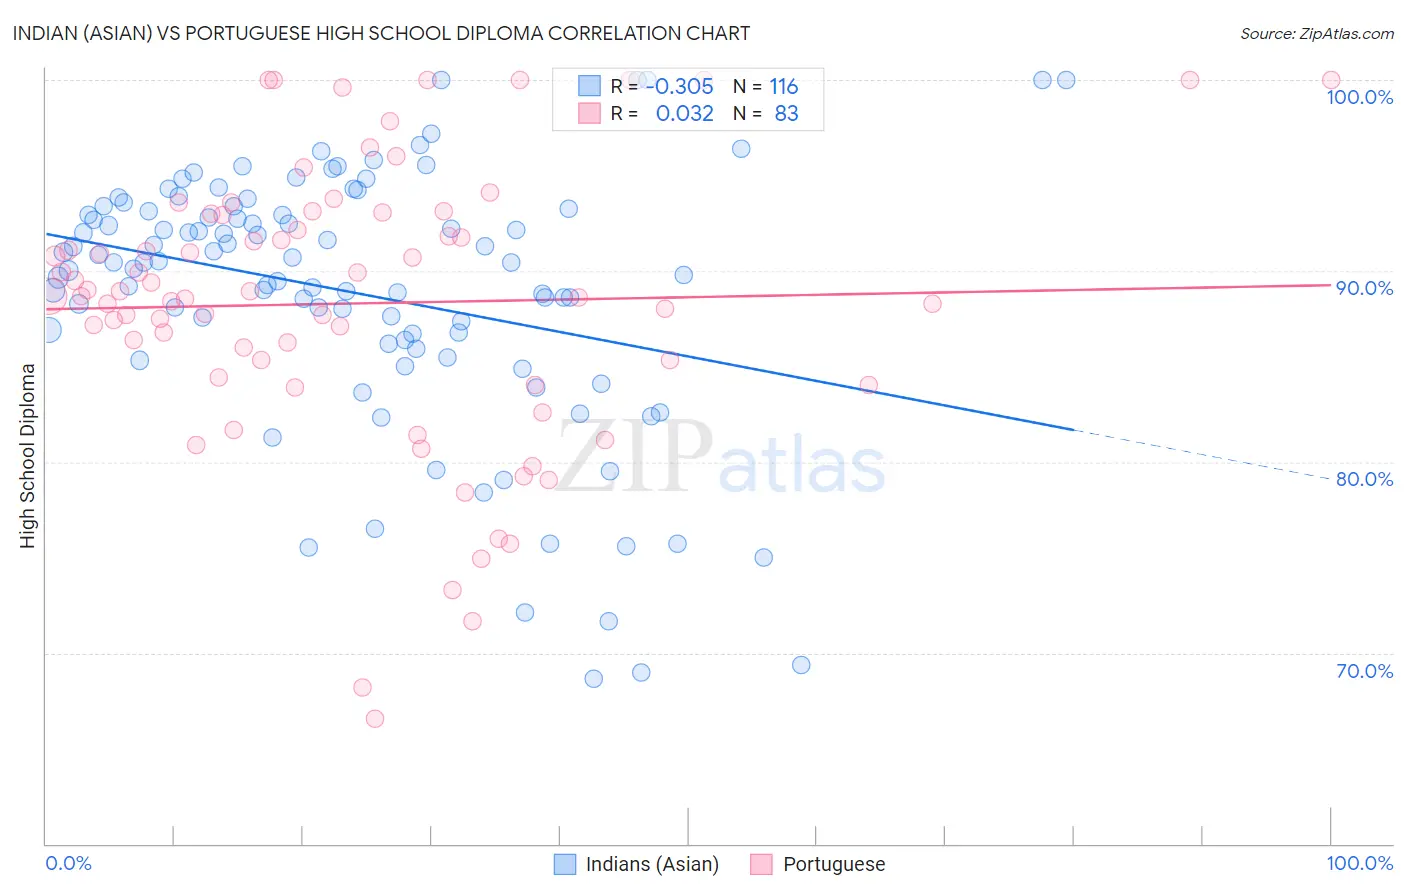
Indian (Asian) vs Portuguese High School Diploma Correlation Chart
The statistical analysis conducted on geographies consisting of 495,347,994 people shows a mild negative correlation between the proportion of Indians (Asian) and percentage of population with at least high school diploma education in the United States with a correlation coefficient (R) of -0.305 and weighted average of 89.6%. Similarly, the statistical analysis conducted on geographies consisting of 450,368,110 people shows no correlation between the proportion of Portuguese and percentage of population with at least high school diploma education in the United States with a correlation coefficient (R) of 0.032 and weighted average of 88.5%, a difference of 1.2%.
High School Diploma Correlation Summary
| Measurement | Indian (Asian) | Portuguese |
| Minimum | 68.7% | 66.5% |
| Maximum | 100.0% | 100.0% |
| Range | 31.3% | 33.5% |
| Mean | 88.8% | 88.3% |
| Median | 90.4% | 88.7% |
| Interquartile 25% (IQ1) | 86.3% | 84.4% |
| Interquartile 75% (IQ3) | 93.2% | 93.0% |
| Interquartile Range (IQR) | 6.9% | 8.5% |
| Standard Deviation (Sample) | 6.8% | 7.4% |
| Standard Deviation (Population) | 6.8% | 7.3% |
Similar Demographics by High School Diploma
Demographics Similar to Indians (Asian) by High School Diploma
In terms of high school diploma, the demographic groups most similar to Indians (Asian) are Chilean (89.6%, a difference of 0.0%), Pakistani (89.6%, a difference of 0.010%), Immigrants from Kenya (89.6%, a difference of 0.020%), Immigrants from Brazil (89.5%, a difference of 0.050%), and Kenyan (89.6%, a difference of 0.060%).
| Demographics | Rating | Rank | High School Diploma |
| Chippewa | 85.6 /100 | #135 | Excellent 89.7% |
| Ugandans | 83.7 /100 | #136 | Excellent 89.7% |
| Arabs | 83.6 /100 | #137 | Excellent 89.7% |
| Assyrians/Chaldeans/Syriacs | 82.5 /100 | #138 | Excellent 89.7% |
| Kenyans | 81.4 /100 | #139 | Excellent 89.6% |
| Immigrants | Egypt | 81.2 /100 | #140 | Excellent 89.6% |
| Chileans | 79.0 /100 | #141 | Good 89.6% |
| Indians (Asian) | 78.8 /100 | #142 | Good 89.6% |
| Pakistanis | 78.3 /100 | #143 | Good 89.6% |
| Immigrants | Kenya | 78.0 /100 | #144 | Good 89.6% |
| Immigrants | Brazil | 76.6 /100 | #145 | Good 89.5% |
| Immigrants | Spain | 76.2 /100 | #146 | Good 89.5% |
| Iraqis | 73.9 /100 | #147 | Good 89.5% |
| Immigrants | Lebanon | 73.4 /100 | #148 | Good 89.5% |
| Immigrants | Poland | 72.9 /100 | #149 | Good 89.5% |
Demographics Similar to Portuguese by High School Diploma
In terms of high school diploma, the demographic groups most similar to Portuguese are Cherokee (88.5%, a difference of 0.0%), Samoan (88.5%, a difference of 0.010%), Immigrants from Sierra Leone (88.6%, a difference of 0.040%), Inupiat (88.5%, a difference of 0.040%), and Arapaho (88.6%, a difference of 0.050%).
| Demographics | Rating | Rank | High School Diploma |
| Koreans | 18.1 /100 | #201 | Poor 88.6% |
| Panamanians | 18.0 /100 | #202 | Poor 88.6% |
| Somalis | 17.5 /100 | #203 | Poor 88.6% |
| Armenians | 17.2 /100 | #204 | Poor 88.6% |
| Immigrants | Micronesia | 16.4 /100 | #205 | Poor 88.6% |
| Arapaho | 16.1 /100 | #206 | Poor 88.6% |
| Immigrants | Sierra Leone | 15.8 /100 | #207 | Poor 88.6% |
| Portuguese | 14.4 /100 | #208 | Poor 88.5% |
| Cherokee | 14.3 /100 | #209 | Poor 88.5% |
| Samoans | 14.0 /100 | #210 | Poor 88.5% |
| Inupiat | 13.1 /100 | #211 | Poor 88.5% |
| South American Indians | 12.2 /100 | #212 | Poor 88.5% |
| Immigrants | Somalia | 11.3 /100 | #213 | Poor 88.4% |
| Immigrants | Cameroon | 10.9 /100 | #214 | Poor 88.4% |
| Crow | 10.9 /100 | #215 | Poor 88.4% |