Indian (Asian) vs Immigrants from Argentina Unemployment Among Ages 55 to 59 years
COMPARE
Indian (Asian)
Immigrants from Argentina
Unemployment Among Ages 55 to 59 years
Unemployment Among Ages 55 to 59 years Comparison
Indians (Asian)
Immigrants from Argentina
4.9%
UNEMPLOYMENT AMONG AGES 55 TO 59 YEARS
7.6/ 100
METRIC RATING
220th/ 347
METRIC RANK
4.6%
UNEMPLOYMENT AMONG AGES 55 TO 59 YEARS
99.5/ 100
METRIC RATING
61st/ 347
METRIC RANK
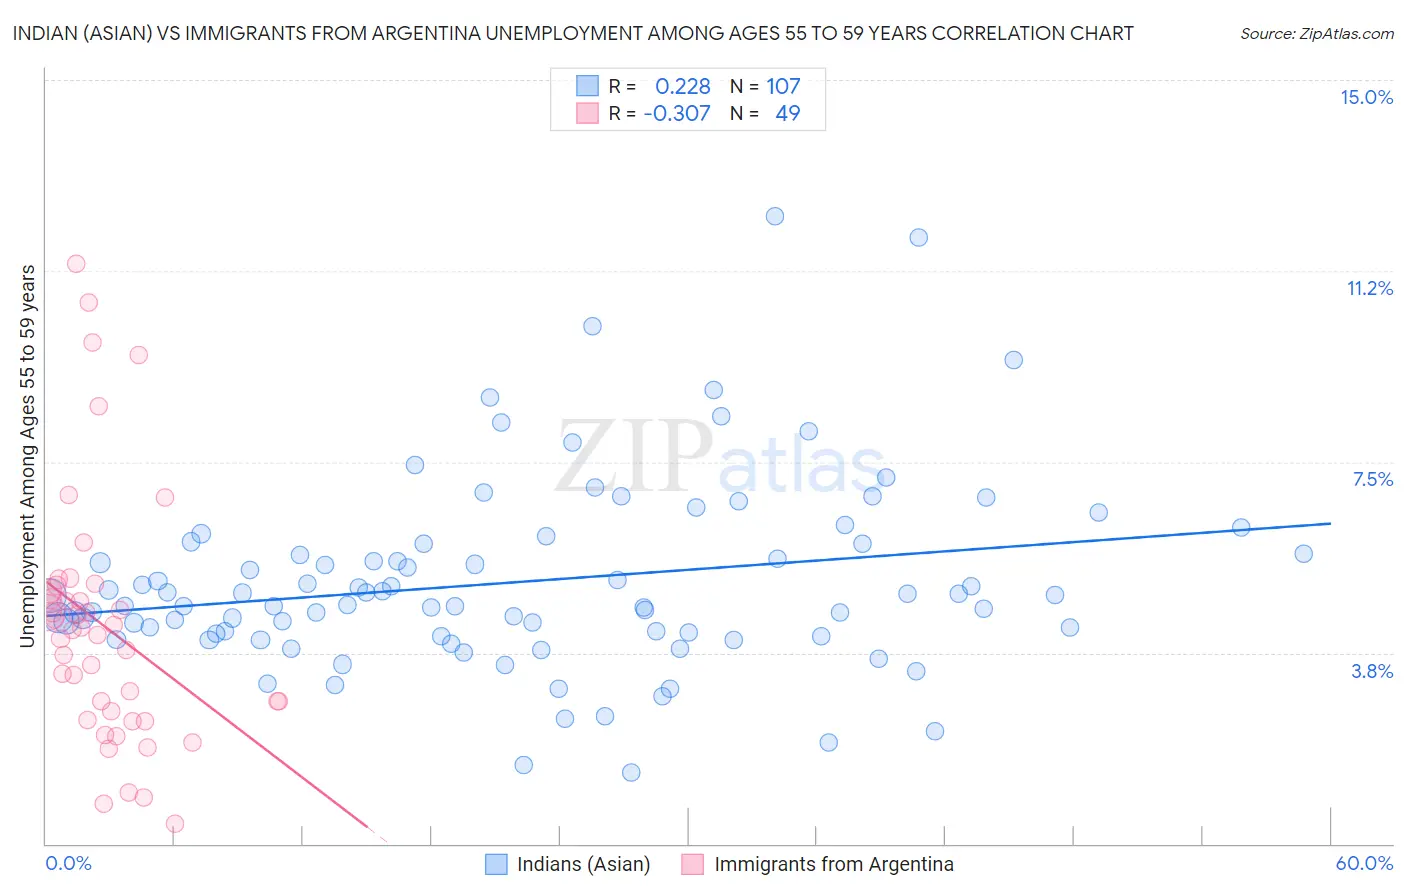
Indian (Asian) vs Immigrants from Argentina Unemployment Among Ages 55 to 59 years Correlation Chart
The statistical analysis conducted on geographies consisting of 447,877,144 people shows a weak positive correlation between the proportion of Indians (Asian) and unemployment rate among population between the ages 55 and 59 in the United States with a correlation coefficient (R) of 0.228 and weighted average of 4.9%. Similarly, the statistical analysis conducted on geographies consisting of 253,318,909 people shows a mild negative correlation between the proportion of Immigrants from Argentina and unemployment rate among population between the ages 55 and 59 in the United States with a correlation coefficient (R) of -0.307 and weighted average of 4.6%, a difference of 8.3%.
Unemployment Among Ages 55 to 59 years Correlation Summary
| Measurement | Indian (Asian) | Immigrants from Argentina |
| Minimum | 1.4% | 0.40% |
| Maximum | 12.3% | 11.4% |
| Range | 10.9% | 11.0% |
| Mean | 5.1% | 4.3% |
| Median | 4.7% | 4.2% |
| Interquartile 25% (IQ1) | 4.1% | 2.5% |
| Interquartile 75% (IQ3) | 5.9% | 5.0% |
| Interquartile Range (IQR) | 1.8% | 2.5% |
| Standard Deviation (Sample) | 1.9% | 2.5% |
| Standard Deviation (Population) | 1.9% | 2.4% |
Similar Demographics by Unemployment Among Ages 55 to 59 years
Demographics Similar to Indians (Asian) by Unemployment Among Ages 55 to 59 years
In terms of unemployment among ages 55 to 59 years, the demographic groups most similar to Indians (Asian) are Nigerian (4.9%, a difference of 0.010%), Immigrants from Austria (4.9%, a difference of 0.060%), Immigrants from Nigeria (4.9%, a difference of 0.060%), Immigrants from Brazil (4.9%, a difference of 0.070%), and Spanish American (4.9%, a difference of 0.080%).
| Demographics | Rating | Rank | Unemployment Among Ages 55 to 59 years |
| Bermudans | 11.0 /100 | #213 | Poor 4.9% |
| Immigrants | Denmark | 10.3 /100 | #214 | Poor 4.9% |
| Syrians | 8.6 /100 | #215 | Tragic 4.9% |
| Spanish Americans | 8.1 /100 | #216 | Tragic 4.9% |
| Immigrants | Brazil | 8.1 /100 | #217 | Tragic 4.9% |
| Immigrants | Austria | 8.0 /100 | #218 | Tragic 4.9% |
| Immigrants | Nigeria | 8.0 /100 | #219 | Tragic 4.9% |
| Indians (Asian) | 7.6 /100 | #220 | Tragic 4.9% |
| Nigerians | 7.5 /100 | #221 | Tragic 4.9% |
| Spanish | 5.1 /100 | #222 | Tragic 5.0% |
| Immigrants | Ireland | 4.8 /100 | #223 | Tragic 5.0% |
| Sub-Saharan Africans | 4.4 /100 | #224 | Tragic 5.0% |
| Costa Ricans | 4.4 /100 | #225 | Tragic 5.0% |
| Immigrants | China | 4.2 /100 | #226 | Tragic 5.0% |
| Immigrants | Iran | 3.7 /100 | #227 | Tragic 5.0% |
Demographics Similar to Immigrants from Argentina by Unemployment Among Ages 55 to 59 years
In terms of unemployment among ages 55 to 59 years, the demographic groups most similar to Immigrants from Argentina are Dutch (4.6%, a difference of 0.090%), Immigrants from Uganda (4.6%, a difference of 0.13%), Slovene (4.6%, a difference of 0.25%), Immigrants from South Central Asia (4.6%, a difference of 0.33%), and Okinawan (4.5%, a difference of 0.36%).
| Demographics | Rating | Rank | Unemployment Among Ages 55 to 59 years |
| Burmese | 99.7 /100 | #54 | Exceptional 4.5% |
| Immigrants | Nepal | 99.6 /100 | #55 | Exceptional 4.5% |
| Welsh | 99.6 /100 | #56 | Exceptional 4.5% |
| Northern Europeans | 99.6 /100 | #57 | Exceptional 4.5% |
| Okinawans | 99.6 /100 | #58 | Exceptional 4.5% |
| Immigrants | Uganda | 99.5 /100 | #59 | Exceptional 4.6% |
| Dutch | 99.5 /100 | #60 | Exceptional 4.6% |
| Immigrants | Argentina | 99.5 /100 | #61 | Exceptional 4.6% |
| Slovenes | 99.3 /100 | #62 | Exceptional 4.6% |
| Immigrants | South Central Asia | 99.3 /100 | #63 | Exceptional 4.6% |
| Argentineans | 99.1 /100 | #64 | Exceptional 4.6% |
| Sudanese | 99.1 /100 | #65 | Exceptional 4.6% |
| Mongolians | 99.0 /100 | #66 | Exceptional 4.6% |
| Ugandans | 99.0 /100 | #67 | Exceptional 4.6% |
| Immigrants | Micronesia | 99.0 /100 | #68 | Exceptional 4.6% |