Indian (Asian) vs Kenyan 3rd Grade
COMPARE
Indian (Asian)
Kenyan
3rd Grade
3rd Grade Comparison
Indians (Asian)
Kenyans
97.4%
3RD GRADE
1.3/ 100
METRIC RATING
243rd/ 347
METRIC RANK
97.8%
3RD GRADE
51.8/ 100
METRIC RATING
171st/ 347
METRIC RANK
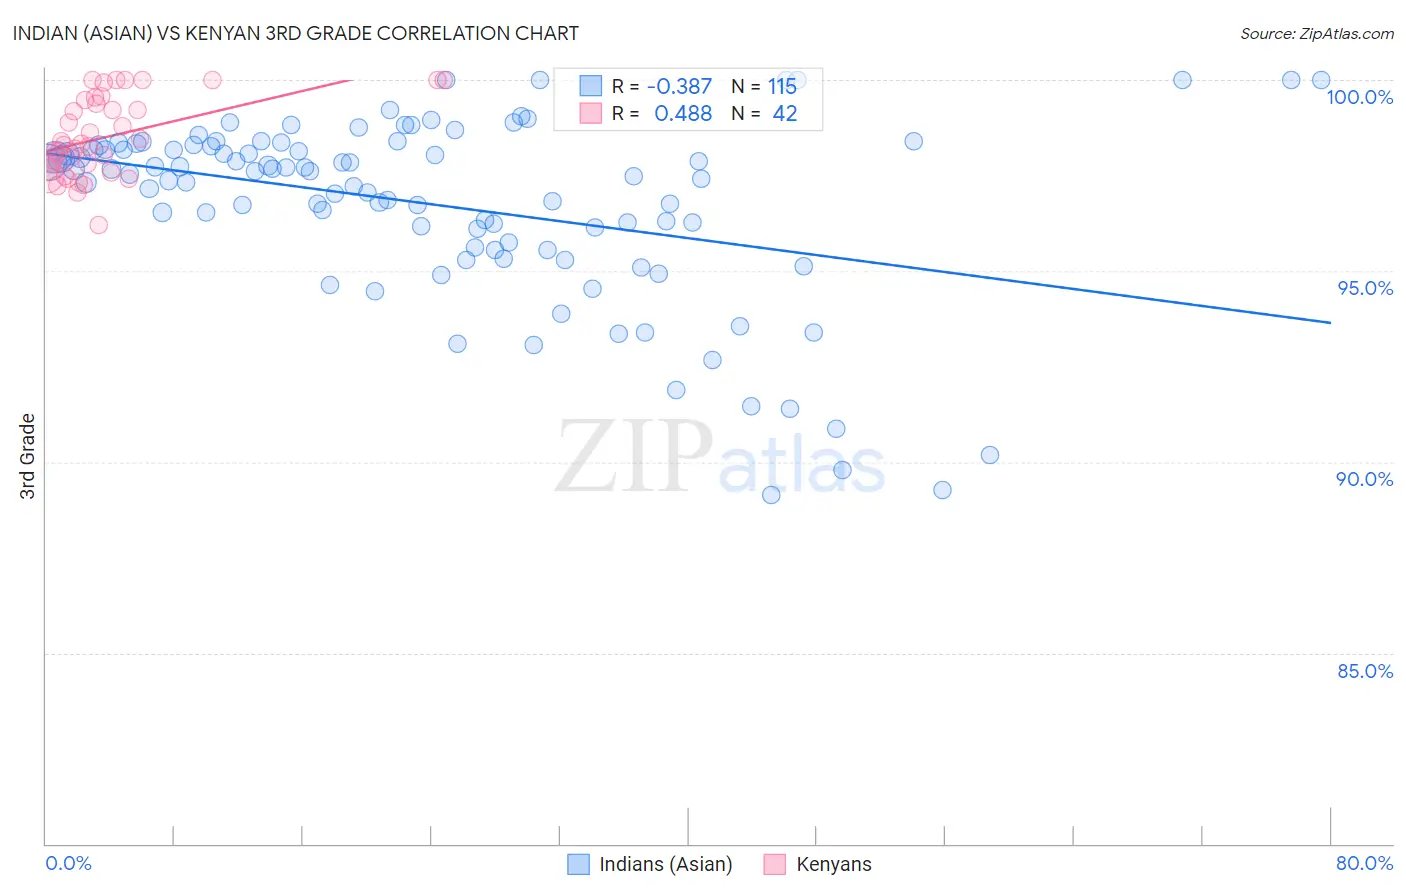
Indian (Asian) vs Kenyan 3rd Grade Correlation Chart
The statistical analysis conducted on geographies consisting of 495,196,037 people shows a mild negative correlation between the proportion of Indians (Asian) and percentage of population with at least 3rd grade education in the United States with a correlation coefficient (R) of -0.387 and weighted average of 97.4%. Similarly, the statistical analysis conducted on geographies consisting of 168,244,481 people shows a moderate positive correlation between the proportion of Kenyans and percentage of population with at least 3rd grade education in the United States with a correlation coefficient (R) of 0.488 and weighted average of 97.8%, a difference of 0.38%.
3rd Grade Correlation Summary
| Measurement | Indian (Asian) | Kenyan |
| Minimum | 89.1% | 96.2% |
| Maximum | 100.0% | 100.0% |
| Range | 10.9% | 3.8% |
| Mean | 96.7% | 98.5% |
| Median | 97.5% | 98.3% |
| Interquartile 25% (IQ1) | 95.6% | 97.7% |
| Interquartile 75% (IQ3) | 98.3% | 99.5% |
| Interquartile Range (IQR) | 2.7% | 1.8% |
| Standard Deviation (Sample) | 2.4% | 1.0% |
| Standard Deviation (Population) | 2.4% | 1.0% |
Similar Demographics by 3rd Grade
Demographics Similar to Indians (Asian) by 3rd Grade
In terms of 3rd grade, the demographic groups most similar to Indians (Asian) are U.S. Virgin Islander (97.4%, a difference of 0.010%), Immigrants from Indonesia (97.4%, a difference of 0.010%), Korean (97.4%, a difference of 0.010%), Asian (97.4%, a difference of 0.010%), and Ethiopian (97.4%, a difference of 0.010%).
| Demographics | Rating | Rank | 3rd Grade |
| Liberians | 1.8 /100 | #236 | Tragic 97.4% |
| Colombians | 1.8 /100 | #237 | Tragic 97.4% |
| Immigrants | Uruguay | 1.7 /100 | #238 | Tragic 97.4% |
| Nigerians | 1.6 /100 | #239 | Tragic 97.4% |
| U.S. Virgin Islanders | 1.4 /100 | #240 | Tragic 97.4% |
| Immigrants | Indonesia | 1.4 /100 | #241 | Tragic 97.4% |
| Koreans | 1.3 /100 | #242 | Tragic 97.4% |
| Indians (Asian) | 1.3 /100 | #243 | Tragic 97.4% |
| Asians | 1.1 /100 | #244 | Tragic 97.4% |
| Ethiopians | 1.1 /100 | #245 | Tragic 97.4% |
| Immigrants | Senegal | 1.0 /100 | #246 | Tragic 97.4% |
| Assyrians/Chaldeans/Syriacs | 1.0 /100 | #247 | Tragic 97.4% |
| Immigrants | Eastern Africa | 0.9 /100 | #248 | Tragic 97.4% |
| South Americans | 0.9 /100 | #249 | Tragic 97.4% |
| Immigrants | Middle Africa | 0.9 /100 | #250 | Tragic 97.4% |
Demographics Similar to Kenyans by 3rd Grade
In terms of 3rd grade, the demographic groups most similar to Kenyans are Spanish American (97.8%, a difference of 0.0%), Immigrants from Korea (97.8%, a difference of 0.0%), Immigrants from Bosnia and Herzegovina (97.8%, a difference of 0.010%), Ugandan (97.8%, a difference of 0.010%), and Dutch West Indian (97.8%, a difference of 0.010%).
| Demographics | Rating | Rank | 3rd Grade |
| Immigrants | Bosnia and Herzegovina | 56.2 /100 | #164 | Average 97.8% |
| Ugandans | 56.1 /100 | #165 | Average 97.8% |
| Dutch West Indians | 55.5 /100 | #166 | Average 97.8% |
| Chileans | 55.3 /100 | #167 | Average 97.8% |
| Immigrants | Spain | 54.3 /100 | #168 | Average 97.8% |
| Comanche | 53.8 /100 | #169 | Average 97.8% |
| Brazilians | 53.7 /100 | #170 | Average 97.8% |
| Kenyans | 51.8 /100 | #171 | Average 97.8% |
| Spanish Americans | 51.8 /100 | #172 | Average 97.8% |
| Immigrants | Korea | 50.9 /100 | #173 | Average 97.8% |
| Navajo | 50.0 /100 | #174 | Average 97.8% |
| Immigrants | Micronesia | 47.6 /100 | #175 | Average 97.8% |
| Immigrants | Poland | 47.1 /100 | #176 | Average 97.8% |
| Egyptians | 46.6 /100 | #177 | Average 97.7% |
| Immigrants | Brazil | 46.4 /100 | #178 | Average 97.7% |