Sierra Leonean vs Finnish 3rd Grade
COMPARE
Sierra Leonean
Finnish
3rd Grade
3rd Grade Comparison
Sierra Leoneans
Finns
97.5%
3RD GRADE
4.6/ 100
METRIC RATING
222nd/ 347
METRIC RANK
98.5%
3RD GRADE
100.0/ 100
METRIC RATING
22nd/ 347
METRIC RANK
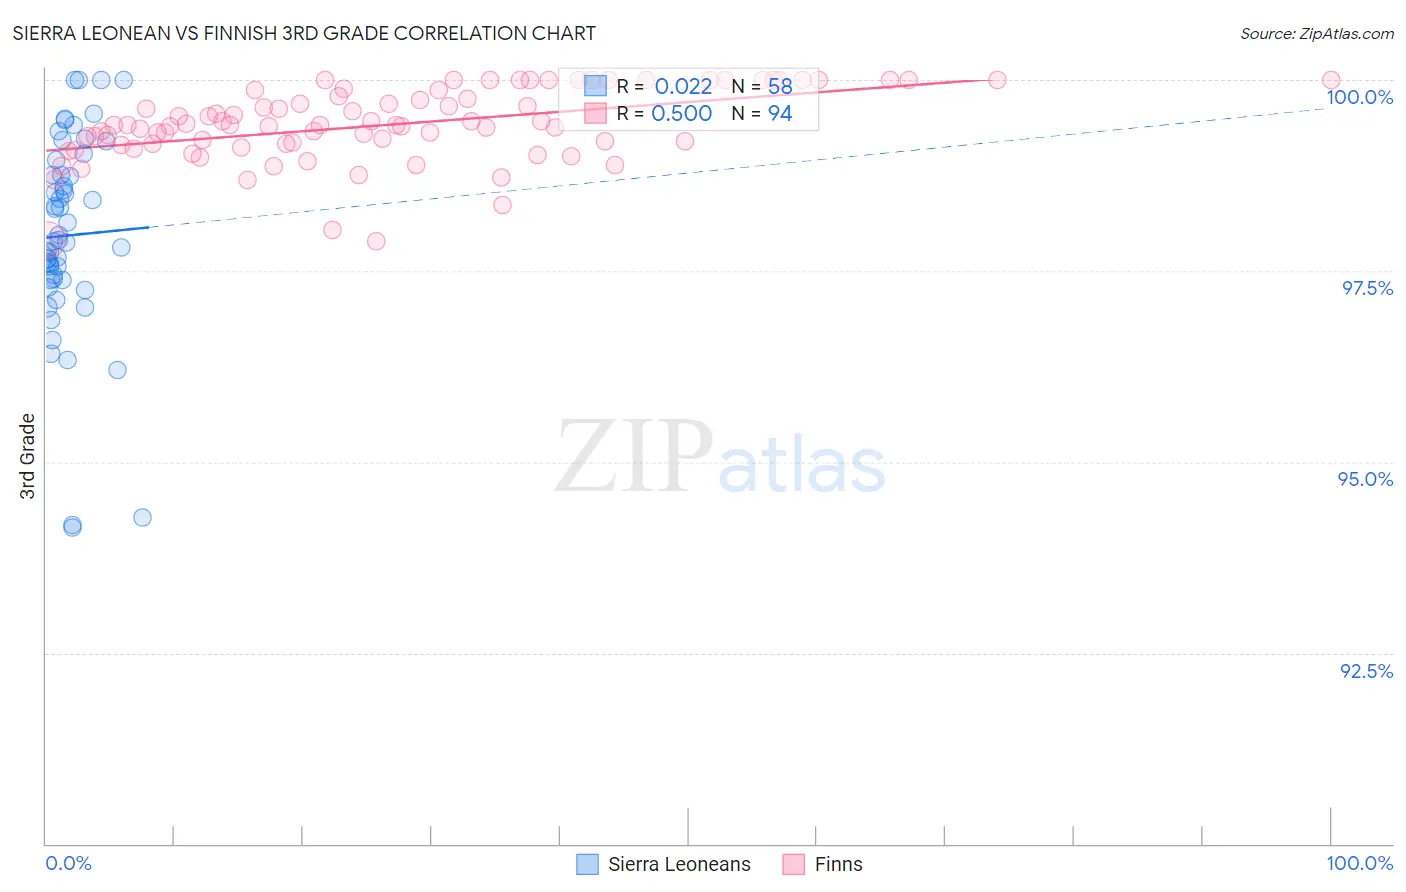
Sierra Leonean vs Finnish 3rd Grade Correlation Chart
The statistical analysis conducted on geographies consisting of 83,337,655 people shows no correlation between the proportion of Sierra Leoneans and percentage of population with at least 3rd grade education in the United States with a correlation coefficient (R) of 0.022 and weighted average of 97.5%. Similarly, the statistical analysis conducted on geographies consisting of 404,675,516 people shows a substantial positive correlation between the proportion of Finns and percentage of population with at least 3rd grade education in the United States with a correlation coefficient (R) of 0.500 and weighted average of 98.5%, a difference of 1.0%.
3rd Grade Correlation Summary
| Measurement | Sierra Leonean | Finnish |
| Minimum | 94.1% | 97.9% |
| Maximum | 100.0% | 100.0% |
| Range | 5.9% | 2.1% |
| Mean | 98.0% | 99.4% |
| Median | 97.9% | 99.4% |
| Interquartile 25% (IQ1) | 97.4% | 99.2% |
| Interquartile 75% (IQ3) | 98.8% | 99.9% |
| Interquartile Range (IQR) | 1.4% | 0.70% |
| Standard Deviation (Sample) | 1.3% | 0.48% |
| Standard Deviation (Population) | 1.3% | 0.48% |
Similar Demographics by 3rd Grade
Demographics Similar to Sierra Leoneans by 3rd Grade
In terms of 3rd grade, the demographic groups most similar to Sierra Leoneans are Immigrants from Syria (97.5%, a difference of 0.0%), Bahamian (97.5%, a difference of 0.0%), Tongan (97.5%, a difference of 0.0%), Immigrants from Nepal (97.5%, a difference of 0.010%), and Immigrants from Panama (97.5%, a difference of 0.010%).
| Demographics | Rating | Rank | 3rd Grade |
| Iraqis | 6.9 /100 | #215 | Tragic 97.5% |
| Samoans | 6.9 /100 | #216 | Tragic 97.5% |
| South American Indians | 5.7 /100 | #217 | Tragic 97.5% |
| Immigrants | Nepal | 5.3 /100 | #218 | Tragic 97.5% |
| Immigrants | Panama | 5.2 /100 | #219 | Tragic 97.5% |
| Immigrants | Morocco | 5.0 /100 | #220 | Tragic 97.5% |
| Uruguayans | 5.0 /100 | #221 | Tragic 97.5% |
| Sierra Leoneans | 4.6 /100 | #222 | Tragic 97.5% |
| Immigrants | Syria | 4.4 /100 | #223 | Tragic 97.5% |
| Bahamians | 4.4 /100 | #224 | Tragic 97.5% |
| Tongans | 4.3 /100 | #225 | Tragic 97.5% |
| Sudanese | 4.1 /100 | #226 | Tragic 97.5% |
| Immigrants | Sudan | 3.4 /100 | #227 | Tragic 97.5% |
| Sub-Saharan Africans | 3.2 /100 | #228 | Tragic 97.5% |
| Senegalese | 3.0 /100 | #229 | Tragic 97.5% |
Demographics Similar to Finns by 3rd Grade
In terms of 3rd grade, the demographic groups most similar to Finns are Lithuanian (98.5%, a difference of 0.0%), Sioux (98.5%, a difference of 0.0%), Polish (98.5%, a difference of 0.010%), Pennsylvania German (98.5%, a difference of 0.010%), and Danish (98.5%, a difference of 0.010%).
| Demographics | Rating | Rank | 3rd Grade |
| Swedes | 100.0 /100 | #15 | Exceptional 98.5% |
| Scottish | 100.0 /100 | #16 | Exceptional 98.5% |
| Dutch | 100.0 /100 | #17 | Exceptional 98.5% |
| Irish | 100.0 /100 | #18 | Exceptional 98.5% |
| Poles | 100.0 /100 | #19 | Exceptional 98.5% |
| Pennsylvania Germans | 100.0 /100 | #20 | Exceptional 98.5% |
| Lithuanians | 100.0 /100 | #21 | Exceptional 98.5% |
| Finns | 100.0 /100 | #22 | Exceptional 98.5% |
| Sioux | 100.0 /100 | #23 | Exceptional 98.5% |
| Danes | 100.0 /100 | #24 | Exceptional 98.5% |
| Scotch-Irish | 100.0 /100 | #25 | Exceptional 98.5% |
| Aleuts | 100.0 /100 | #26 | Exceptional 98.5% |
| Croatians | 100.0 /100 | #27 | Exceptional 98.5% |
| French | 100.0 /100 | #28 | Exceptional 98.4% |
| French Canadians | 100.0 /100 | #29 | Exceptional 98.4% |