Indian (Asian) vs Slovene Bachelor's Degree
COMPARE
Indian (Asian)
Slovene
Bachelor's Degree
Bachelor's Degree Comparison
Indians (Asian)
Slovenes
47.4%
BACHELOR'S DEGREE
100.0/ 100
METRIC RATING
18th/ 347
METRIC RANK
39.1%
BACHELOR'S DEGREE
79.5/ 100
METRIC RATING
145th/ 347
METRIC RANK
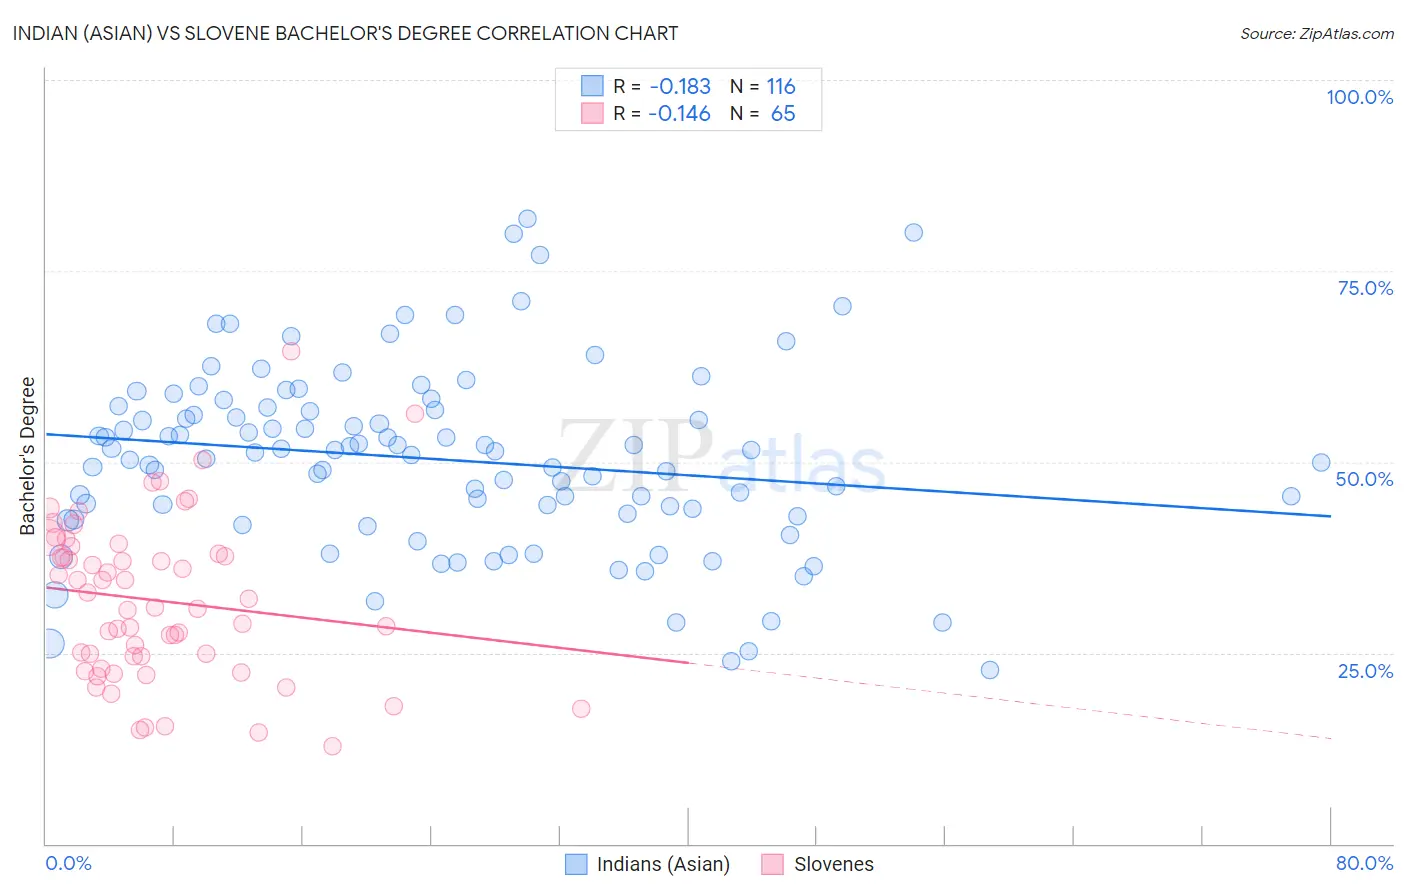
Indian (Asian) vs Slovene Bachelor's Degree Correlation Chart
The statistical analysis conducted on geographies consisting of 495,247,229 people shows a poor negative correlation between the proportion of Indians (Asian) and percentage of population with at least bachelor's degree education in the United States with a correlation coefficient (R) of -0.183 and weighted average of 47.4%. Similarly, the statistical analysis conducted on geographies consisting of 261,339,823 people shows a poor negative correlation between the proportion of Slovenes and percentage of population with at least bachelor's degree education in the United States with a correlation coefficient (R) of -0.146 and weighted average of 39.1%, a difference of 21.4%.
Bachelor's Degree Correlation Summary
| Measurement | Indian (Asian) | Slovene |
| Minimum | 22.8% | 12.8% |
| Maximum | 81.8% | 64.4% |
| Range | 59.0% | 51.7% |
| Mean | 50.4% | 31.8% |
| Median | 51.3% | 30.9% |
| Interquartile 25% (IQ1) | 43.1% | 23.8% |
| Interquartile 75% (IQ3) | 56.9% | 38.5% |
| Interquartile Range (IQR) | 13.9% | 14.7% |
| Standard Deviation (Sample) | 11.9% | 10.6% |
| Standard Deviation (Population) | 11.9% | 10.5% |
Similar Demographics by Bachelor's Degree
Demographics Similar to Indians (Asian) by Bachelor's Degree
In terms of bachelor's degree, the demographic groups most similar to Indians (Asian) are Eastern European (47.5%, a difference of 0.15%), Cambodian (47.2%, a difference of 0.43%), Immigrants from Switzerland (47.1%, a difference of 0.65%), Immigrants from Ireland (47.1%, a difference of 0.66%), and Immigrants from Belgium (47.0%, a difference of 0.86%).
| Demographics | Rating | Rank | Bachelor's Degree |
| Immigrants | Australia | 100.0 /100 | #11 | Exceptional 48.5% |
| Immigrants | China | 100.0 /100 | #12 | Exceptional 48.4% |
| Immigrants | South Central Asia | 100.0 /100 | #13 | Exceptional 48.3% |
| Immigrants | Hong Kong | 100.0 /100 | #14 | Exceptional 48.2% |
| Immigrants | Eastern Asia | 100.0 /100 | #15 | Exceptional 48.1% |
| Soviet Union | 100.0 /100 | #16 | Exceptional 47.9% |
| Eastern Europeans | 100.0 /100 | #17 | Exceptional 47.5% |
| Indians (Asian) | 100.0 /100 | #18 | Exceptional 47.4% |
| Cambodians | 100.0 /100 | #19 | Exceptional 47.2% |
| Immigrants | Switzerland | 100.0 /100 | #20 | Exceptional 47.1% |
| Immigrants | Ireland | 100.0 /100 | #21 | Exceptional 47.1% |
| Immigrants | Belgium | 100.0 /100 | #22 | Exceptional 47.0% |
| Immigrants | Sweden | 100.0 /100 | #23 | Exceptional 47.0% |
| Immigrants | Korea | 100.0 /100 | #24 | Exceptional 47.0% |
| Burmese | 100.0 /100 | #25 | Exceptional 46.9% |
Demographics Similar to Slovenes by Bachelor's Degree
In terms of bachelor's degree, the demographic groups most similar to Slovenes are Immigrants from Afghanistan (39.1%, a difference of 0.030%), Swedish (39.1%, a difference of 0.040%), Polish (39.1%, a difference of 0.050%), Immigrants from Sierra Leone (39.0%, a difference of 0.070%), and Iraqi (39.0%, a difference of 0.21%).
| Demographics | Rating | Rank | Bachelor's Degree |
| Europeans | 85.6 /100 | #138 | Excellent 39.5% |
| Immigrants | Sudan | 84.5 /100 | #139 | Excellent 39.4% |
| Immigrants | Armenia | 84.1 /100 | #140 | Excellent 39.4% |
| South American Indians | 83.6 /100 | #141 | Excellent 39.3% |
| Immigrants | North Macedonia | 81.6 /100 | #142 | Excellent 39.2% |
| Poles | 79.8 /100 | #143 | Good 39.1% |
| Immigrants | Afghanistan | 79.7 /100 | #144 | Good 39.1% |
| Slovenes | 79.5 /100 | #145 | Good 39.1% |
| Swedes | 79.2 /100 | #146 | Good 39.1% |
| Immigrants | Sierra Leone | 79.0 /100 | #147 | Good 39.0% |
| Iraqis | 78.1 /100 | #148 | Good 39.0% |
| Immigrants | Poland | 77.5 /100 | #149 | Good 39.0% |
| South Americans | 77.3 /100 | #150 | Good 38.9% |
| Immigrants | Africa | 76.5 /100 | #151 | Good 38.9% |
| Sudanese | 76.4 /100 | #152 | Good 38.9% |