Indian (Asian) vs Pueblo Bachelor's Degree
COMPARE
Indian (Asian)
Pueblo
Bachelor's Degree
Bachelor's Degree Comparison
Indians (Asian)
Pueblo
47.4%
BACHELOR'S DEGREE
100.0/ 100
METRIC RATING
18th/ 347
METRIC RANK
25.5%
BACHELOR'S DEGREE
0.0/ 100
METRIC RATING
338th/ 347
METRIC RANK
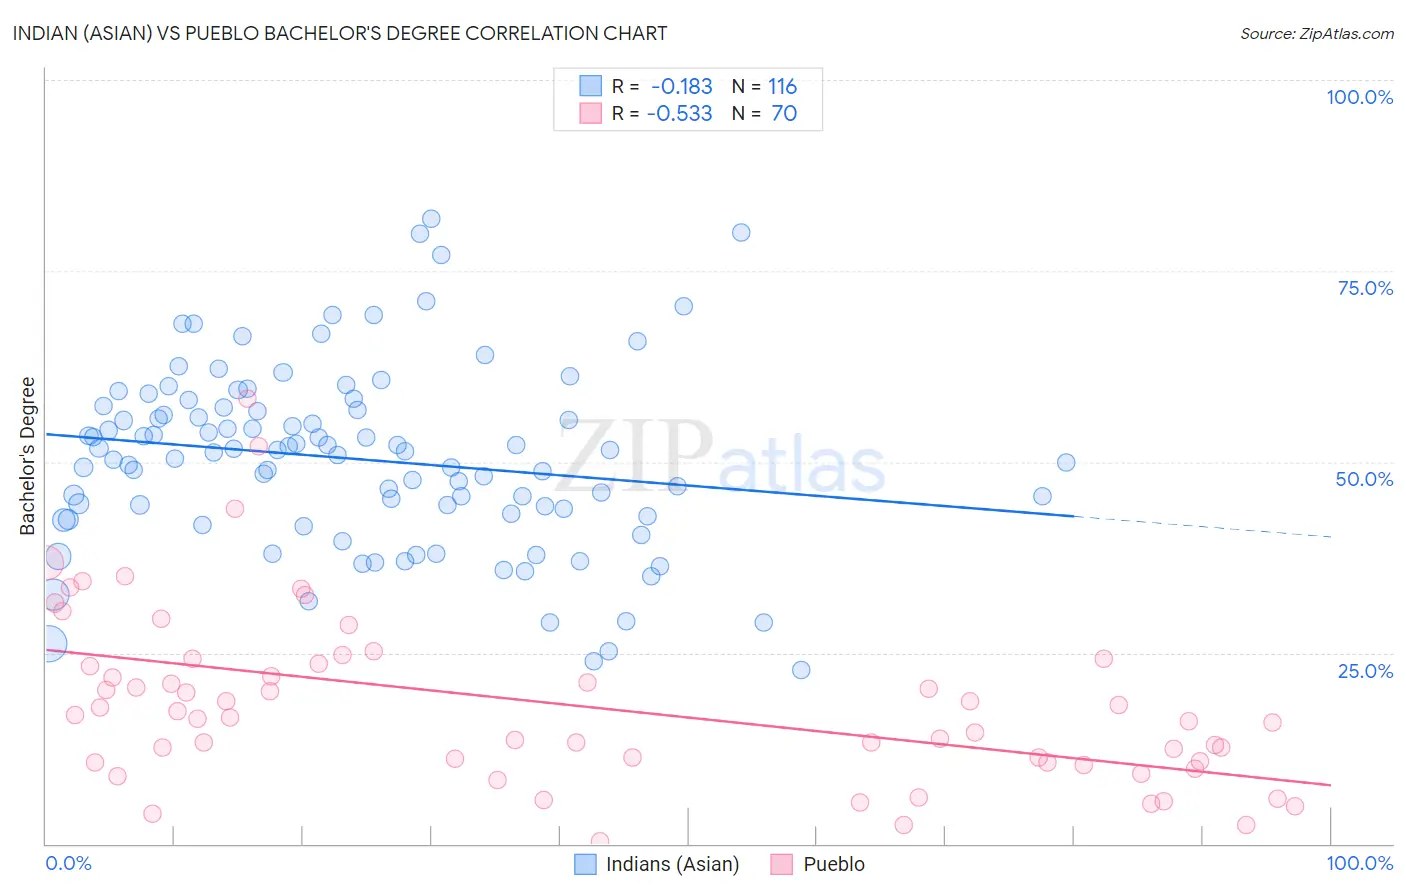
Indian (Asian) vs Pueblo Bachelor's Degree Correlation Chart
The statistical analysis conducted on geographies consisting of 495,247,229 people shows a poor negative correlation between the proportion of Indians (Asian) and percentage of population with at least bachelor's degree education in the United States with a correlation coefficient (R) of -0.183 and weighted average of 47.4%. Similarly, the statistical analysis conducted on geographies consisting of 120,082,344 people shows a substantial negative correlation between the proportion of Pueblo and percentage of population with at least bachelor's degree education in the United States with a correlation coefficient (R) of -0.533 and weighted average of 25.5%, a difference of 85.8%.
Bachelor's Degree Correlation Summary
| Measurement | Indian (Asian) | Pueblo |
| Minimum | 22.8% | 0.30% |
| Maximum | 81.8% | 58.3% |
| Range | 59.0% | 58.0% |
| Mean | 50.4% | 18.2% |
| Median | 51.3% | 16.5% |
| Interquartile 25% (IQ1) | 43.1% | 10.6% |
| Interquartile 75% (IQ3) | 56.9% | 23.6% |
| Interquartile Range (IQR) | 13.9% | 12.9% |
| Standard Deviation (Sample) | 11.9% | 11.4% |
| Standard Deviation (Population) | 11.9% | 11.3% |
Similar Demographics by Bachelor's Degree
Demographics Similar to Indians (Asian) by Bachelor's Degree
In terms of bachelor's degree, the demographic groups most similar to Indians (Asian) are Eastern European (47.5%, a difference of 0.15%), Cambodian (47.2%, a difference of 0.43%), Immigrants from Switzerland (47.1%, a difference of 0.65%), Immigrants from Ireland (47.1%, a difference of 0.66%), and Immigrants from Belgium (47.0%, a difference of 0.86%).
| Demographics | Rating | Rank | Bachelor's Degree |
| Immigrants | Australia | 100.0 /100 | #11 | Exceptional 48.5% |
| Immigrants | China | 100.0 /100 | #12 | Exceptional 48.4% |
| Immigrants | South Central Asia | 100.0 /100 | #13 | Exceptional 48.3% |
| Immigrants | Hong Kong | 100.0 /100 | #14 | Exceptional 48.2% |
| Immigrants | Eastern Asia | 100.0 /100 | #15 | Exceptional 48.1% |
| Soviet Union | 100.0 /100 | #16 | Exceptional 47.9% |
| Eastern Europeans | 100.0 /100 | #17 | Exceptional 47.5% |
| Indians (Asian) | 100.0 /100 | #18 | Exceptional 47.4% |
| Cambodians | 100.0 /100 | #19 | Exceptional 47.2% |
| Immigrants | Switzerland | 100.0 /100 | #20 | Exceptional 47.1% |
| Immigrants | Ireland | 100.0 /100 | #21 | Exceptional 47.1% |
| Immigrants | Belgium | 100.0 /100 | #22 | Exceptional 47.0% |
| Immigrants | Sweden | 100.0 /100 | #23 | Exceptional 47.0% |
| Immigrants | Korea | 100.0 /100 | #24 | Exceptional 47.0% |
| Burmese | 100.0 /100 | #25 | Exceptional 46.9% |
Demographics Similar to Pueblo by Bachelor's Degree
In terms of bachelor's degree, the demographic groups most similar to Pueblo are Hopi (25.3%, a difference of 0.93%), Inupiat (25.8%, a difference of 1.1%), Immigrants from Mexico (26.1%, a difference of 2.4%), Native/Alaskan (26.3%, a difference of 3.1%), and Lumbee (24.8%, a difference of 3.2%).
| Demographics | Rating | Rank | Bachelor's Degree |
| Immigrants | Azores | 0.0 /100 | #331 | Tragic 27.3% |
| Menominee | 0.0 /100 | #332 | Tragic 27.3% |
| Mexicans | 0.0 /100 | #333 | Tragic 27.1% |
| Arapaho | 0.0 /100 | #334 | Tragic 26.6% |
| Natives/Alaskans | 0.0 /100 | #335 | Tragic 26.3% |
| Immigrants | Mexico | 0.0 /100 | #336 | Tragic 26.1% |
| Inupiat | 0.0 /100 | #337 | Tragic 25.8% |
| Pueblo | 0.0 /100 | #338 | Tragic 25.5% |
| Hopi | 0.0 /100 | #339 | Tragic 25.3% |
| Lumbee | 0.0 /100 | #340 | Tragic 24.8% |
| Yuman | 0.0 /100 | #341 | Tragic 24.5% |
| Yakama | 0.0 /100 | #342 | Tragic 24.5% |
| Tohono O'odham | 0.0 /100 | #343 | Tragic 24.4% |
| Navajo | 0.0 /100 | #344 | Tragic 23.6% |
| Pima | 0.0 /100 | #345 | Tragic 23.2% |