Spanish American vs Maltese 9th Grade
COMPARE
Spanish American
Maltese
9th Grade
9th Grade Comparison
Spanish Americans
Maltese
94.2%
9TH GRADE
2.6/ 100
METRIC RATING
241st/ 347
METRIC RANK
96.3%
9TH GRADE
100.0/ 100
METRIC RATING
30th/ 347
METRIC RANK
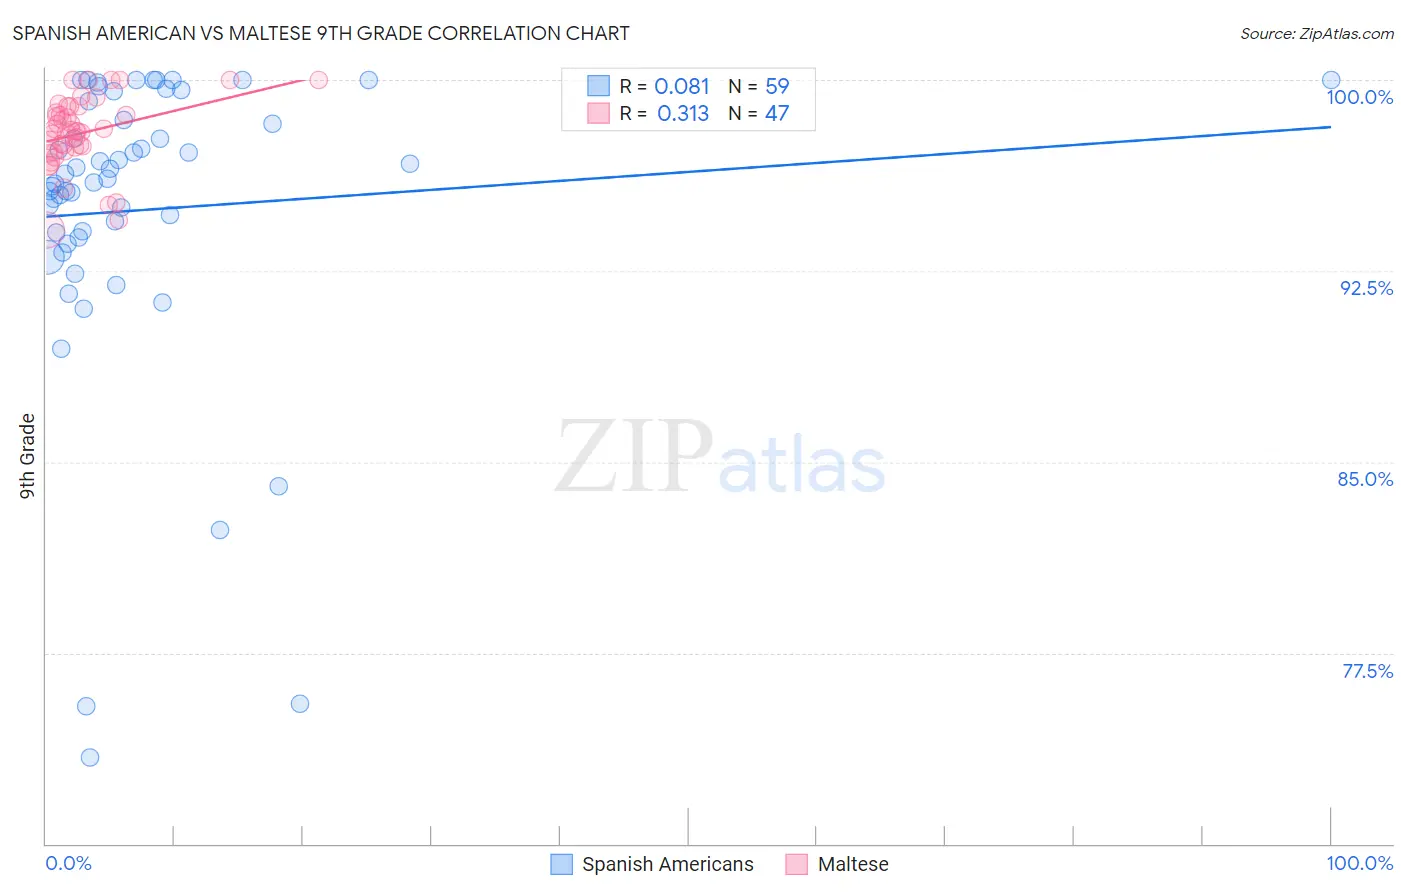
Spanish American vs Maltese 9th Grade Correlation Chart
The statistical analysis conducted on geographies consisting of 103,168,542 people shows a slight positive correlation between the proportion of Spanish Americans and percentage of population with at least 9th grade education in the United States with a correlation coefficient (R) of 0.081 and weighted average of 94.2%. Similarly, the statistical analysis conducted on geographies consisting of 126,476,608 people shows a mild positive correlation between the proportion of Maltese and percentage of population with at least 9th grade education in the United States with a correlation coefficient (R) of 0.313 and weighted average of 96.3%, a difference of 2.1%.
9th Grade Correlation Summary
| Measurement | Spanish American | Maltese |
| Minimum | 73.4% | 94.1% |
| Maximum | 100.0% | 100.0% |
| Range | 26.6% | 5.9% |
| Mean | 94.9% | 97.9% |
| Median | 96.1% | 98.0% |
| Interquartile 25% (IQ1) | 93.8% | 97.2% |
| Interquartile 75% (IQ3) | 99.2% | 99.0% |
| Interquartile Range (IQR) | 5.3% | 1.7% |
| Standard Deviation (Sample) | 5.9% | 1.4% |
| Standard Deviation (Population) | 5.9% | 1.4% |
Similar Demographics by 9th Grade
Demographics Similar to Spanish Americans by 9th Grade
In terms of 9th grade, the demographic groups most similar to Spanish Americans are Immigrants from Ethiopia (94.3%, a difference of 0.0%), South American Indian (94.3%, a difference of 0.010%), Immigrants from China (94.3%, a difference of 0.010%), Somali (94.3%, a difference of 0.020%), and Korean (94.3%, a difference of 0.020%).
| Demographics | Rating | Rank | 9th Grade |
| Costa Ricans | 3.5 /100 | #234 | Tragic 94.3% |
| Bolivians | 3.3 /100 | #235 | Tragic 94.3% |
| Somalis | 2.9 /100 | #236 | Tragic 94.3% |
| Koreans | 2.9 /100 | #237 | Tragic 94.3% |
| South American Indians | 2.8 /100 | #238 | Tragic 94.3% |
| Immigrants | China | 2.8 /100 | #239 | Tragic 94.3% |
| Immigrants | Ethiopia | 2.7 /100 | #240 | Tragic 94.3% |
| Spanish Americans | 2.6 /100 | #241 | Tragic 94.2% |
| Immigrants | Middle Africa | 2.2 /100 | #242 | Tragic 94.2% |
| Immigrants | Cameroon | 2.1 /100 | #243 | Tragic 94.2% |
| Dutch West Indians | 2.0 /100 | #244 | Tragic 94.2% |
| Paiute | 1.9 /100 | #245 | Tragic 94.2% |
| Senegalese | 1.9 /100 | #246 | Tragic 94.2% |
| Afghans | 1.8 /100 | #247 | Tragic 94.2% |
| Immigrants | Somalia | 1.4 /100 | #248 | Tragic 94.1% |
Demographics Similar to Maltese by 9th Grade
In terms of 9th grade, the demographic groups most similar to Maltese are British (96.3%, a difference of 0.0%), Belgian (96.3%, a difference of 0.010%), Chinese (96.3%, a difference of 0.020%), Luxembourger (96.3%, a difference of 0.020%), and Scotch-Irish (96.3%, a difference of 0.030%).
| Demographics | Rating | Rank | 9th Grade |
| Czechs | 100.0 /100 | #23 | Exceptional 96.4% |
| Latvians | 100.0 /100 | #24 | Exceptional 96.4% |
| French | 100.0 /100 | #25 | Exceptional 96.3% |
| French Canadians | 100.0 /100 | #26 | Exceptional 96.3% |
| Scotch-Irish | 100.0 /100 | #27 | Exceptional 96.3% |
| Eastern Europeans | 100.0 /100 | #28 | Exceptional 96.3% |
| Chinese | 100.0 /100 | #29 | Exceptional 96.3% |
| Maltese | 100.0 /100 | #30 | Exceptional 96.3% |
| British | 100.0 /100 | #31 | Exceptional 96.3% |
| Belgians | 100.0 /100 | #32 | Exceptional 96.3% |
| Luxembourgers | 100.0 /100 | #33 | Exceptional 96.3% |
| Hungarians | 100.0 /100 | #34 | Exceptional 96.2% |
| Bulgarians | 99.9 /100 | #35 | Exceptional 96.2% |
| Northern Europeans | 99.9 /100 | #36 | Exceptional 96.2% |
| Estonians | 99.9 /100 | #37 | Exceptional 96.1% |